
Weekly Newsletter April 13th to April 17th
RECAPPING LAST WEEK
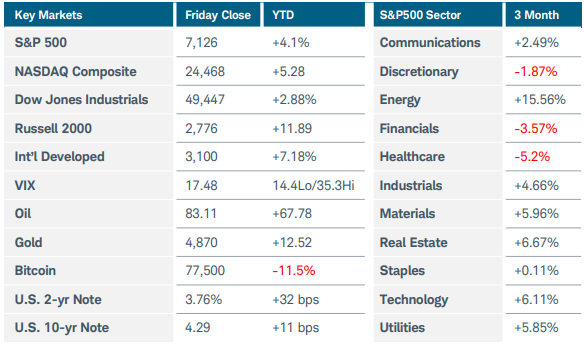
U.S. equity indices rallied sharply for a third straight week as Middle East tensions rapidly deescalated. Iran’s statement that the Strait of Hormuz was open for commercial shipping during the ceasefire window throttled risk on across all asset classes on Friday. Oil prices fell over $10 per barrel on Friday alone, helping to ease inflation fears across the globe. The S&P500 and Nasdaq-100 advanced 4.5% and 6% respectively, meaning the former has risen 13% the latter 17% since their March 31st lows. Small cap stocks were even stronger, with the Russell 2000 and Nasdaq Composite soaring 6% and 7%. Within the S&P500 itself, the winning themes were growth and travel. The Iranian situation is far from resolved, so while the progress toward peace is welcome, macro investors can likely expect volatility to persist a bit longer. Rate-sensitive sectors showed continued vulnerability: housing, for example, remained a weak spot, with existing home sales falling to 3.98 million and the NAHB coming in at 34, indicating builder sentiment remains under pressure. Small business optimism declined to 95.8, but both here and with housing, these readings are somewhat moderated by indications of more favorable conditions on the horizon. On the inflation front, PPI was impacted significantly by the situation in Iran, rising 0.5% m/m (4.0% y/y), though hopefully that situation will prove temporary. Growth indicators remain mixed but stable with the Empire manufacturing index coming in weak vs. a stronger Philly report. Industrial production dipped, but labor markets remained firm as jobless claims were below expectations at 207K. Overall, the US economy looks stable and benefited from a big boost on Friday. The energy shock had been a huge weight on every economy on Earth—the latest developments increased the likelihood that global growth for the year would meet the IMF’s base case of 3%, rather than the 2% that could have prevailed had the Strait remained closed. European industrial production remained positive, though the ECB still notes downside growth risks and upside inflation risks. The drop in energy prices also provides some cushion. UK GDP came in at 0.5% and Australia’s unemployment rate held steady at 4.3%, indicating the labor market remains tight. China’s data reinforces the stabilization narrative with GDP printing at 5% and industrial production at 5.7%. Their exports were weak at 2.5% but import growth of 27.8% signaled internal resilience. The global economy is hoping inflation expectations and lower geopolitical tensions will be tempered by additional drops in energy prices. If that can hold, conditions should be favorable for the near future.
THE WEEK AHEAD
The market’s first question this week is whether this relief rally can survive contact with real data, even more so after the weekends added uncertainty. The focus shifts back to fundamentals with U.S. retail sales, PMIs, jobless claims, and a heavy slate of earnings. The question of whether the risk will continue easing, providing the global economy with a soft landing, depends on continued inflation easing, durable growth, and central bank actions. Speaking of central banks, Fed politics become a market event on Tuesday when President Trump’s Fed chair nominee, Kevin Warsh, appears at his Senate hearing. Investors will parse Warsh’s responses for clues about future rate policy. In the U.S., PMIs and core PCE will give some guidance on inflation. Consumer spending and income data along with the revised UoM consumer sentiment survey will provide an updated reading on the recently tenuous health of the American consumer. Globally, energy prices and supply will be paramount, as additional energy spikes would overpower everything else. In the absence of another crisis, investors will look to European activity data with retail sales and consumer confidence reports midweek. UK data will be plentiful, with the claimant count change, unemployment rate, CPIs, and PMI’s all arriving this week. U.S. crude oil inventories on Wednesday will hold more weight than normal, and defense contractors Northrop Grumman and Lockheed Martin, plus AT&T, Tesla, and several airlines will report earnings during the week.
CHART OF THE WEEK
Overseas momentum
The Dow Jones Transportation index first reached 18,000 back in 2021 and spent the next 5 years chopping sideways below that level. That changed in January of this year when it broke out with strength running straight to 20K. It took a couple weeks to retreat to its former resistance, now support as a textbook throwback and continuation pattern. The rocket up from that support has been impressive popping 28% in the last month. The MACD made an impressive high after breaking resistance, but this rally is even approaching that same level showing serious strength. Opening the Strait of Hormuz obviously had an effect reducing fuel costs for all of them, along with the improved conditions affecting other sectors as well. The mood has flipped to risk on, and the way it happened poured gas of the fire burning in the transportation sector.
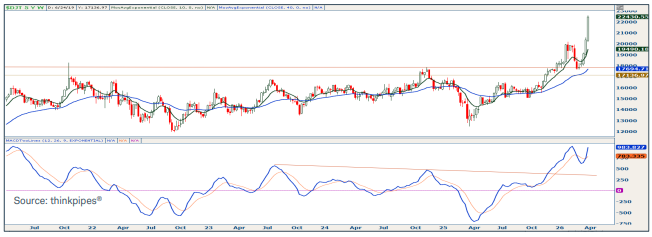
Source: Charles Schwab Corporation
IMPORTANT LEGAL NOTICE AND DISCLOSURE INFORMATION
Investment advisory service is provided by SVL Holding Corporation dba SVL Investments Management (“SVL”), a California registered investment advisor. Advisory services are subject to advisory fees as disclosed on Form ADV.
Investing involves risks, and investment decisions should be based on your own goals, time horizon, and tolerance for risk. The forecasts or forward-looking statements are based on assumptions, may not materialize, and are subject to revision without notice. International investments carry additional risks, which include differences in financial reporting standards, currency exchange rates, political risks unique to a specific country, foreign taxes and regulations, and the potential for illiquid markets.
Past performance may not be indicative of future results. Therefore, no current or prospective client should assume that future performance of any specific investment, investment strategy (including the investments and/or investment strategies recommended or undertaken by SVL) or product made reference to directly or indirectly by SVL in its web site, or indirectly via a link to an unaffiliated third party web site, will be profitable or equal the corresponding indicated performance level(s). Different types of investments involve varying degrees of risk, and there can be no assurance that the future performance of any specific investment, investment strategy, or product (including the investments and/or investment strategies recommended or undertaken by SVL), or any non-investment related content, made reference to directly or indirectly on this site will either be suitable or profitable for a client or prospective client’s investment portfolio. Historical performance results for investment indices and/or categories generally do not reflect the deduction of transaction and/or custodial charges, the deduction of an investment management fee, or the impact of taxes, the incurrence of which would have the effect of decreasing historical performance results for investment indices.
Certain portions of SVL‘s web site (i.e. blog, Insights, newsletters, articles, commentaries, etc.) may contain a discussion of, and/or provide access to, SVL‘s (and those of other investment and non-investment professionals) positions and/or recommendations as of a specific prior date. Due to various factors, including changing market conditions, such discussion may no longer be reflective of current position(s) and/or recommendation(s). Moreover, no client or prospective client should assume that any such discussion serves as the receipt of, or a substitute for, personalized advice from SVL or from any other investment professional. SVL is neither an attorney nor accountant, and no portion of the web site content should be interpreted as legal, accounting or tax advice.
Rankings and/or recognition by unaffiliated rating services and/or publications should not be construed by a client or prospective client as a guarantee that he/she will experience a certain level of results if SVL is engaged, or continues to be engaged, to provide investment advisory services, nor should it be construed as a current or past endorsement of SVL by any of its clients. Rankings published by magazines, and others, generally base their selections exclusively on information prepared and/or submitted by the recognized adviser.
To the extent that any client or prospective client utilizes any economic calculator or similar device contained within or linked to SVL‘s web site, the client and/or prospective client acknowledges and understands that the information resulting from the use of any such calculator/device, is not, and should not be construed, in any manner whatsoever, as the receipt of, or a substitute for, personalized individual advice from SVL, or from any other investment professional.
Each client and prospective client agrees, as a condition precedent to his/her/its access to SVL‘s web site, to release and hold harmless SVL, its officers, directors, owners, employees and agents from any and all adverse consequences resulting from any of his/her/its actions and/or omissions which are independent of his/her/its receipt of personalized individual advice from SVL.