
Weekly Newsletter April 20th to April 24th
RECAPPING LAST WEEK
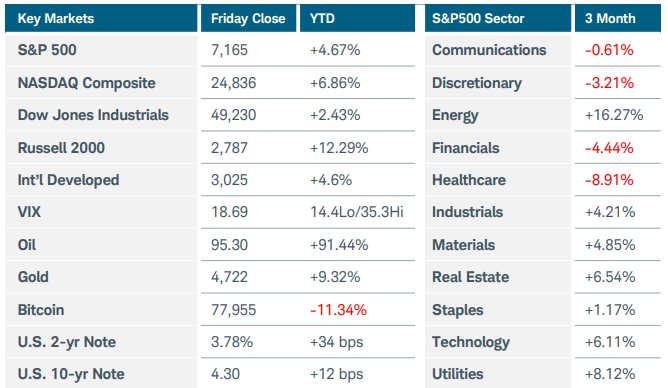
With the exception of the Nasdaq-100’s 2% pop, U.S equity markets were mostly flat, with no other index moving even 1%. We would expect to see some consolidation after the multi-week April rally, with the S&P500 up nearly 12% from its March 30 low. While Nasdaq stars the Magnificent 7, and shared in the sector’s gains, they were not driving outperformance. Instead, semiconductor strength carried the tape, helped by Intel’s strong revenue outlook and a broader chip rally. Oil remained central to the macro narrative, with WTI crude rallying 12%. While oil eased Friday on hopes for renewed U.S.-Iran diplomacy, Middle East supply concerns related to the Strait of Hormuz chokepoint have kept prices elevated. Interest rate yields drifted higher and expectations for Fed rate cuts continued to fade as observers recognize that the Fed faces a complicated path navigating higher oil prices and geopolitical risk. March retail sales surged 1.7%, their best monthly change in more than a year, signaling that higher gas prices have not yet led the American consumer to cut their discretionary spending. Housing demand aligned with retail spend, with pending home sales 1.5% higher despite rising mortgage rates. Manufacturing and services PMI registered expansion above 50, pushing the S&P Global Composite PMI to 52. Jobless claims ticked up to 214K—not high enough to stoke additional labor market concerns. Consumer sentiment fell near the bear-market lows of 2022, even as equities today are registering new record highs. The preceding numbers still reflect a great deal of uncertainty, both from the ongoing war in Iran and from the incoming Fed Chair Kevin Warsh. His “regime change” testimony in front of the senate last week has caused concern about future policy direction. As has been the case since the start of the war, global markets looked fragile compared to the U.S. The German flash composite PMI fell to 48.3 and the sinking IFO Business Climate Index indicated the direction of corporate sentiment. Consumer sentiment in the eurozone dropped to a 3-year low. In the U.K., unemployment rose to 5.2% as CPI rose to 3.3%, reminding investors that inflation is omnipresent. Japan’s core inflation accelerated to 1.8%, as businesses reported the fastest-ever recorded increase in selling prices, and manufacturing activity started to slow. Australian PMIs crossed back into expansion, but here too, inflation surged to a 4-year high.
THE WEEK AHEAD
The chief macro event risk at the moment relates to the Fed—the impact of this week’s meeting will likely come more from the statement and press conference than the rate decision itself. Will policymakers emphasize sticky inflation, oil-driven price risk, still-resilient growth, or any opening for future rate cuts? Despite rising yields, firmer energy prices, and a steady drumbeat of headline risk, equity indices managed to keep rolling higher last week. Still, their Sisyphean climb is slowing as each policy post and diplomatic flare-up adds a few pebbles’ weight to the boulder. On the domestic front, labor market data and forward-looking metrics from retail sales and PMIs will help assess whether growth remains resilient or if any knock-on effects from spiking energy costs are filtering through. Thursday features the Fed’s preferred metric for inflation, core PCE. Advance GDP q/q, and weekly unemployment claims arrive as well. On the earnings front, megacap technology earnings will be the equity-market stress test: Microsoft, Alphabet, Amazon, Meta, and Apple are expected to report, providing investors with a direct referendum on AI capex, cloud demand, margins, and whether these stocks’ index leadership can continue. Internationally, global central banks meet this week with Japan, Canada, and the U.K. all making rate statements and Wednesday morning a release of EUR M3 money supply. Keep an eye on European data to see if their sluggish activity continues, and more importantly how the ECB reacts to it. It will all be greatly impacted by what happens in Iran, the Strait of Hormuz, and energy prices
CHART OF THE WEEK
Knock your SOX off
While the Philadelphia Semiconductor Index (SOX) has been screaming higher for the better part of the past year, its dramatic rise the past month still stands out. It surged 10% last week, 50% since the March 30th low, and 215% from the low a year ago. Investors increasingly question whether the Magnificent 7’s massive AI-related capital spending will ultimately generate sufficient returns to justify the buildout, particularly in the case of the semiconductor companies that have the greatest exposure to that investment cycle. Still, the SOX constituents have directly benefited and show no signs of abating. Despite seemingly unlimited demand, the earnings multiples look surprisingly low compared to other large cap tech companies. The index price and its MACD below are both at all-time highs, the 40-week EMA (blue line) provided ideal support, setting up April’s rally, and the Fibonacci extension target appears to sit above $12K. Capital isn’t exiting the AI space, but it is rotating through it —and for now, semiconductors are the main beneficiary.
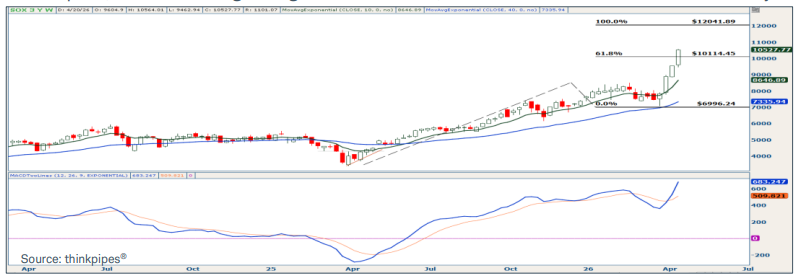
Source: Charles Schwab Corporation
IMPORTANT LEGAL NOTICE AND DISCLOSURE INFORMATION
Investment advisory service is provided by SVL Holding Corporation dba SVL Investments Management (“SVL”), a California registered investment advisor. Advisory services are subject to advisory fees as disclosed on Form ADV.
Investing involves risks, and investment decisions should be based on your own goals, time horizon, and tolerance for risk. The forecasts or forward-looking statements are based on assumptions, may not materialize, and are subject to revision without notice. International investments carry additional risks, which include differences in financial reporting standards, currency exchange rates, political risks unique to a specific country, foreign taxes and regulations, and the potential for illiquid markets.
Past performance may not be indicative of future results. Therefore, no current or prospective client should assume that future performance of any specific investment, investment strategy (including the investments and/or investment strategies recommended or undertaken by SVL) or product made reference to directly or indirectly by SVL in its web site, or indirectly via a link to an unaffiliated third party web site, will be profitable or equal the corresponding indicated performance level(s). Different types of investments involve varying degrees of risk, and there can be no assurance that the future performance of any specific investment, investment strategy, or product (including the investments and/or investment strategies recommended or undertaken by SVL), or any non-investment related content, made reference to directly or indirectly on this site will either be suitable or profitable for a client or prospective client’s investment portfolio. Historical performance results for investment indices and/or categories generally do not reflect the deduction of transaction and/or custodial charges, the deduction of an investment management fee, or the impact of taxes, the incurrence of which would have the effect of decreasing historical performance results for investment indices.
Certain portions of SVL‘s web site (i.e. blog, Insights, newsletters, articles, commentaries, etc.) may contain a discussion of, and/or provide access to, SVL‘s (and those of other investment and non-investment professionals) positions and/or recommendations as of a specific prior date. Due to various factors, including changing market conditions, such discussion may no longer be reflective of current position(s) and/or recommendation(s). Moreover, no client or prospective client should assume that any such discussion serves as the receipt of, or a substitute for, personalized advice from SVL or from any other investment professional. SVL is neither an attorney nor accountant, and no portion of the web site content should be interpreted as legal, accounting or tax advice.
Rankings and/or recognition by unaffiliated rating services and/or publications should not be construed by a client or prospective client as a guarantee that he/she will experience a certain level of results if SVL is engaged, or continues to be engaged, to provide investment advisory services, nor should it be construed as a current or past endorsement of SVL by any of its clients. Rankings published by magazines, and others, generally base their selections exclusively on information prepared and/or submitted by the recognized adviser.
To the extent that any client or prospective client utilizes any economic calculator or similar device contained within or linked to SVL‘s web site, the client and/or prospective client acknowledges and understands that the information resulting from the use of any such calculator/device, is not, and should not be construed, in any manner whatsoever, as the receipt of, or a substitute for, personalized individual advice from SVL, or from any other investment professional.
Each client and prospective client agrees, as a condition precedent to his/her/its access to SVL‘s web site, to release and hold harmless SVL, its officers, directors, owners, employees and agents from any and all adverse consequences resulting from any of his/her/its actions and/or omissions which are independent of his/her/its receipt of personalized individual advice from SVL.