
Weekly Newsletter April 27th to May 1st
RECAPPING LAST WEEK
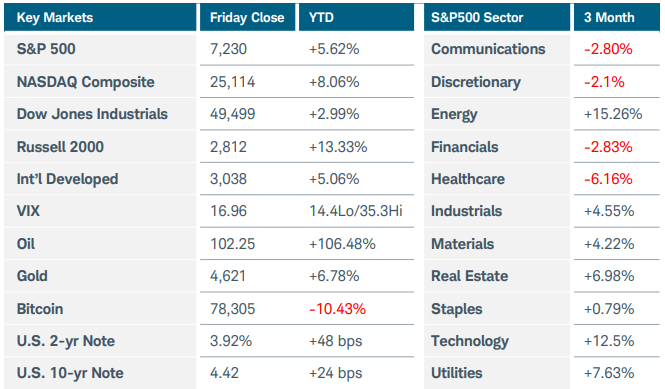
U.S. equity indexes extended their April rally, rising modestly last week as the S&P500 and Nasdaq reached fresh record highs, led by Big Tech after stellar earnings boosted share prices. Ten of eleven S&P500 sectors finished higher on the week – materials were the sole loser. As expected, the Fed held rates steady, but votes on policy were more divided than in past meetings. Core PCE, the Fed’s preferred measure of inflation rose 0.3% MoM and 3.2% YoY. This reading was surprisingly tame given oil prices, but still complicated the future path of Fed policy. Speaking of oil, futures prices rose another 7% last week, clearing $110/barrel before settling near $100 as inventories in the U.S. dropped by 6.2 million barrels. The dollar index opened the week higher when U.S.–Iran talks stalled, but the buck faded through the week, helping gold, silver, and bitcoin hold steady. U.S. growth metrics remained strong, with Q1 GDP improving to 2.0% from Q4 2025’s 0.5% level. Durable goods and capital shipments showed continued momentum, and ISM Manufacturing PMI remained in expansion territory at 52.7. All 5 of the Mag 7 stocks that reported earnings last week beat expectations, but only AAPL, AMZN, and GOOGL saw a positive impact on their stock prices. Labor market data was mixed: at 189k, jobless claims were at a 50-year low, yet the ADP employment reading pointed to a slowdown. Consumer confidence ticked higher and while housing prices are still up year over year, they were flat MoM. Overseas, the Bank of Japan increased inflation forecasts but stopped short of indicating any rate hikes. Europe continues to lag. Although Germany posted modest growth, the broader Eurozone GDP disappointed, and unemployment ticked up to 6.2% giving the ECB more freedom to act than the U.S. Fed currently enjoys. Canadian and U.K. central banks held rates steady, and an increase in Australian inflation proved it’s a global issue that belies the argument that financial markets need interest rate cuts.
THE WEEK AHEAD
U.S. labor market data will be the primary macro catalyst, with April nonfarm payrolls due Friday. Before the key-risk event, the market will receive several labor-market “previews”, including JOLTS job openings, ADP private payrolls, and weekly jobless claims. ISM Services will be closely watched after manufacturing data showed resilient activity but rising input costs. The Fed backdrop remains important even though there’s no major policy decision on the calendar. The ”higher for longer” narrative could eventually become problematic for equity markets, but so far, those markets have persevered. Fewer companies will report earnings this week, but we’ll still hear from more than 100 S&P constituents, including Advanced Micro Devices (AMD), Strategy Inc (MSTR), Disney (DIS), Uber (UBER), Coinbase (COIN), and McDonald’s (MCD). While it sounds counterintuitive, foreign markets may focus most on whether strength in the U.S. dollar and the “good growth” narrative will survive the arrival of a wide range of U.S. data. If the trend of U.S. outperformance and weakness from China and Europe persists, it will strengthen the dollar and squeeze global liquidity. And while the importance of the Iran situation seems to be fading, its impact—especially on oil prices— still bears watching. The week closes with four different Fed members’ speeches, and investors will listen carefully for any indications of future central bank policy.
CHART OF THE WEEK
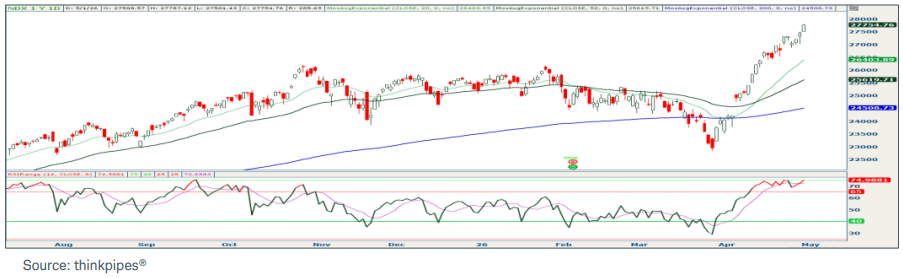
Mega-cap earnings lift NASDAQ
The NASDAQ-100 Index (NDX) led all major U.S. indexes to new all-time highs again last week, with a late push after all of the 5 reporting Magnificent 7 stocks beat earnings expectations. The stock performance of each company varied, but the actual earnings beats were impressive, signaling the concerns over their return on AI capital expenditures may have been overblown. AAPL and MSFT each beat by 5%, META by 55%, with AMZN and GOOGL blowing expectations out by 74% and 94% respectively. This brings NDX YTD total gain to 10%, with a staggering 21% rally off the March 30 lows. The war in Iran, oil prices over $100 per barrel, sticky inflation, uncertainty at the Fed, and expectations that higher rates will persist: each of these should be dragging on equity prices, but equities just don’t seem to be listening. Sentiment indicators are flashing overbought, which is a concern; however, last May was the same and its rally persisted another 6 months. The nearest support is 27,000, as long as NDX holds above that level, upward pressure remains intact.
Source: Charles Schwab Corporation
IMPORTANT LEGAL NOTICE AND DISCLOSURE INFORMATION
Investment advisory service is provided by SVL Holding Corporation dba SVL Investments Management (“SVL”), a California registered investment advisor. Advisory services are subject to advisory fees as disclosed on Form ADV.
Investing involves risks, and investment decisions should be based on your own goals, time horizon, and tolerance for risk. The forecasts or forward-looking statements are based on assumptions, may not materialize, and are subject to revision without notice. International investments carry additional risks, which include differences in financial reporting standards, currency exchange rates, political risks unique to a specific country, foreign taxes and regulations, and the potential for illiquid markets.
Past performance may not be indicative of future results. Therefore, no current or prospective client should assume that future performance of any specific investment, investment strategy (including the investments and/or investment strategies recommended or undertaken by SVL) or product made reference to directly or indirectly by SVL in its web site, or indirectly via a link to an unaffiliated third party web site, will be profitable or equal the corresponding indicated performance level(s). Different types of investments involve varying degrees of risk, and there can be no assurance that the future performance of any specific investment, investment strategy, or product (including the investments and/or investment strategies recommended or undertaken by SVL), or any non-investment related content, made reference to directly or indirectly on this site will either be suitable or profitable for a client or prospective client’s investment portfolio. Historical performance results for investment indices and/or categories generally do not reflect the deduction of transaction and/or custodial charges, the deduction of an investment management fee, or the impact of taxes, the incurrence of which would have the effect of decreasing historical performance results for investment indices.
Certain portions of SVL‘s web site (i.e. blog, Insights, newsletters, articles, commentaries, etc.) may contain a discussion of, and/or provide access to, SVL‘s (and those of other investment and non-investment professionals) positions and/or recommendations as of a specific prior date. Due to various factors, including changing market conditions, such discussion may no longer be reflective of current position(s) and/or recommendation(s). Moreover, no client or prospective client should assume that any such discussion serves as the receipt of, or a substitute for, personalized advice from SVL or from any other investment professional. SVL is neither an attorney nor accountant, and no portion of the web site content should be interpreted as legal, accounting or tax advice.
Rankings and/or recognition by unaffiliated rating services and/or publications should not be construed by a client or prospective client as a guarantee that he/she will experience a certain level of results if SVL is engaged, or continues to be engaged, to provide investment advisory services, nor should it be construed as a current or past endorsement of SVL by any of its clients. Rankings published by magazines, and others, generally base their selections exclusively on information prepared and/or submitted by the recognized adviser.
To the extent that any client or prospective client utilizes any economic calculator or similar device contained within or linked to SVL‘s web site, the client and/or prospective client acknowledges and understands that the information resulting from the use of any such calculator/device, is not, and should not be construed, in any manner whatsoever, as the receipt of, or a substitute for, personalized individual advice from SVL, or from any other investment professional.
Each client and prospective client agrees, as a condition precedent to his/her/its access to SVL‘s web site, to release and hold harmless SVL, its officers, directors, owners, employees and agents from any and all adverse consequences resulting from any of his/her/its actions and/or omissions which are independent of his/her/its receipt of personalized individual advice from SVL.