

Weekly Newsletter August 10th to August 14th
RECAPPING LAST WEEK
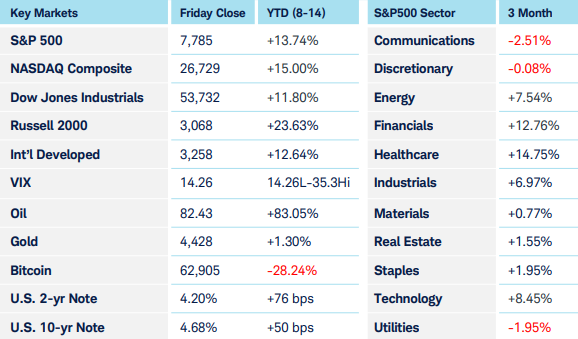
Equity markets continued their march higher last week, as the S&P500 and Russell 2000 hit new all-time highs for the second consecutive week. The NASDAQ came within 2% of its early June all-time high, though it continues lagging its counterparts. Nine of eleven S&P500 sectors gained ground, with materials and consumer discretionary falling behind. Crude oil rose 6.5% on yet another stall in negotiations with Iran, sending Energy up 7.5%, making it the clear leader. 86% of S&P500 stocks have reported earnings that exceeded expectations, with 88% reporting. Currently Q2 earnings are tracking a staggering 50% higher than the same time last year, which has helped to ease markets’ concern with unprecedented AI capex spending. We saw a new development in the capex story last week, as Nvidia’s CEO Jensen Huang took a ‘wall street tour” and reached preliminary agreements with Goldman Sachs and four other firms to raise $500 billion to build additional AI infrastructure, on top of the more than $700 billion the hyper-scalers were already expected to spend this year. The deal potentially extends the massive spending path well into next year and helps explain the market’s overall strength this week. Inflation numbers supported the rally, as July’s CPI data came in right on the screws, rising just 0.1% month-over-month and 3.4% year-over-year, with producer prices unchanged. Those numbers reduced expectations for a rate hike at the September Fed meeting to 35%, down from 55% a week earlier, and 80% in late July. Jobless claims remained low at 209K, easing concerns from the payroll report the week before. Despite all the good news, Treasury yields remained elevated, with the 10-year closing at 4.68%. Most other metrics stayed constructive as the dollar held firm, credit spreads stayed tight, and volatility continued pressing lower. International equities rallied as well, with emerging markets taking the lead, confirming the markets risk-on posture. Precious metals rose modestly last week, but bitcoin can’t seem to catch a break, losing another 3%.
THE WEEK AHEAD
This week is packed with economic data, but the focus will be on the release of July’s FOMC minutes as investors look for clues regarding the Fed’s posture leading up to the September meeting. The decision to hold rates steady in July featured three dissenters so these minutes could reveal how close the other nine were to voting for a hike. U.S. housing and manufacturing data will appear throughout the week, and inflation data from Canada, The Eurozone, and Japan will tell whether global inflation is cooling alongside the U.S., though the recent rise in energy prices won’t be reflected in those reports. Japan’s GDP release could have implications for further tightening from the BOJ, and at midweek we’ll see the U.K. and Australia’s employment data. Earnings reports will be retail-heavy: Home Depot weighs in Tuesday, Target, Lowe’s, and TJX deliver results on Wednesday, and Walmart and Ross Stores report Thursday. The main concerns will be oil prices and treasury yields—any retreat from recent highs in these areas could turn the markets’ current headwind into a tailwind, adding further support. On the other hand, continued pressure would make it difficult for equities to continue their advance.
CHART OF THE WEEK
Elliott Waves Continue
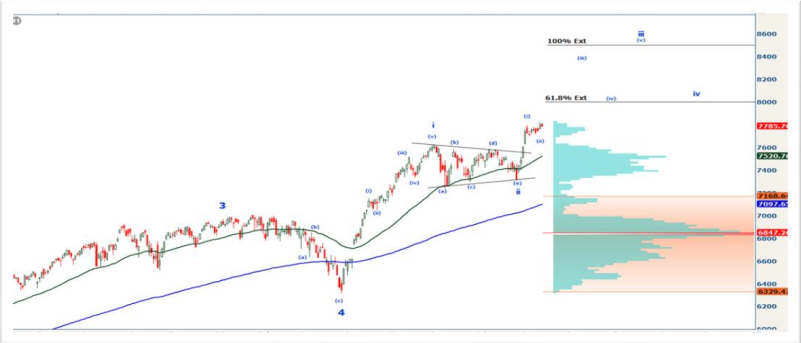
We’ve been watching the S&P500 through an Elliott Wave lens for years. The wave counts are more accurate for some scenarios than others, but over the past 18 months, its predictive power has been impressive. You can watch a replay of the full hour we spent earlier this year going through the details here, but briefly, it’s so far tracking just as expected. The “Liberation Day” drop in April of 2025 offered a clear wave 4, setting up the wave 5 rally, which also subdivides into 5 waves. The low in March of this year counts best as the 4th wave of that larger 5, setting up one more wave 5 of a smaller degree, which of course sub-divides the same way. This is where it gets interesting: wave 1, after the March low, was $1300 strong and lasted two months. Wave 2 was a triangle corrective wave that also lasted two months. Wave 3 is typically the longest and strongest of the 5, and since it has only been going for 2 weeks there is potential strength still to come. Fibonacci extensions come in handy when prices are exploring new highs. Here, they line up with 2 round numbers overhead. The 61.8% extension of wave 1 lands right at 8,000, and the 100% sits at 8,500. There are never any guarantees about the future, but the market conditions mentioned above along with the Elliott Wave structure outlined here are signaling continued upside.
Source: Charles Schwab Corporation
IMPORTANT LEGAL NOTICE AND DISCLOSURE INFORMATION
Investment advisory service is provided by SVL Holding Corporation dba SVL Investments Management (“SVL”), a California registered investment advisor. Advisory services are subject to advisory fees as disclosed on Form ADV.
Investing involves risks, and investment decisions should be based on your own goals, time horizon, and tolerance for risk. The forecasts or forward-looking statements are based on assumptions, may not materialize, and are subject to revision without notice. International investments carry additional risks, which include differences in financial reporting standards, currency exchange rates, political risks unique to a specific country, foreign taxes and regulations, and the potential for illiquid markets.
Past performance may not be indicative of future results. Therefore, no current or prospective client should assume that future performance of any specific investment, investment strategy (including the investments and/or investment strategies recommended or undertaken by SVL) or product made reference to directly or indirectly by SVL in its web site, or indirectly via a link to an unaffiliated third party web site, will be profitable or equal the corresponding indicated performance level(s). Different types of investments involve varying degrees of risk, and there can be no assurance that the future performance of any specific investment, investment strategy, or product (including the investments and/or investment strategies recommended or undertaken by SVL), or any non-investment related content, made reference to directly or indirectly on this site will either be suitable or profitable for a client or prospective client’s investment portfolio. Historical performance results for investment indices and/or categories generally do not reflect the deduction of transaction and/or custodial charges, the deduction of an investment management fee, or the impact of taxes, the incurrence of which would have the effect of decreasing historical performance results for investment indices.
Certain portions of SVL‘s web site (i.e. blog, Insights, newsletters, articles, commentaries, etc.) may contain a discussion of, and/or provide access to, SVL‘s (and those of other investment and non-investment professionals) positions and/or recommendations as of a specific prior date. Due to various factors, including changing market conditions, such discussion may no longer be reflective of current position(s) and/or recommendation(s). Moreover, no client or prospective client should assume that any such discussion serves as the receipt of, or a substitute for, personalized advice from SVL or from any other investment professional. SVL is neither an attorney nor accountant, and no portion of the web site content should be interpreted as legal, accounting or tax advice.
Rankings and/or recognition by unaffiliated rating services and/or publications should not be construed by a client or prospective client as a guarantee that he/she will experience a certain level of results if SVL is engaged, or continues to be engaged, to provide investment advisory services, nor should it be construed as a current or past endorsement of SVL by any of its clients. Rankings published by magazines, and others, generally base their selections exclusively on information prepared and/or submitted by the recognized adviser.
To the extent that any client or prospective client utilizes any economic calculator or similar device contained within or linked to SVL‘s web site, the client and/or prospective client acknowledges and understands that the information resulting from the use of any such calculator/device, is not, and should not be construed, in any manner whatsoever, as the receipt of, or a substitute for, personalized individual advice from SVL, or from any other investment professional.
Each client and prospective client agrees, as a condition precedent to his/her/its access to SVL‘s web site, to release and hold harmless SVL, its officers, directors, owners, employees and agents from any and all adverse consequences resulting from any of his/her/its actions and/or omissions which are independent of his/her/its receipt of personalized individual advice from SVL.