
Weekly Newsletter August 25th to August 29th
RECAPPING LAST WEEK
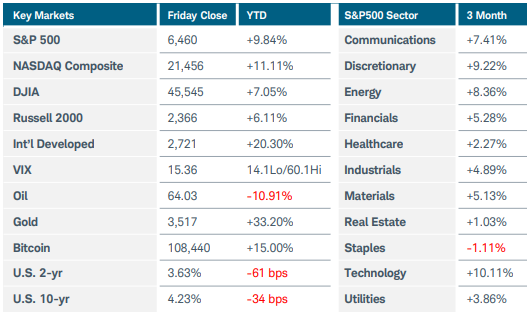
U.S. equity indices ended little changed in the final week of August after the latest inflation readings came in largely in line with expectations. Meanwhile, the U.S. dollar remained under pressure and long-term Treasury yields rose as the escalating feud between the White House and the Federal Reserve stoked concerns about the central bank’s independence. S&P500 sector performance tilted negative, but energy continued its recent rise, up 2.5%. Nvidia weighed on the technology sector after issuing a tepid sales forecast due to looming export uncertainty, while Marvel Technology plunged more than 18% as the artificial intelligence chip company said it expects weaker data center revenue. Gold futures gained 3% to $3,500, a record closing high. Parsing the economic data, July’s PCE price index revealed solid consumer spending and a pickup in services inflation, but with the Fed focused on a softening labor market, investors still expect an interest rate cut in September. The headline PCE price index increased 0.2% MoM and 2.6% YoY, while the core reading rose 0.3% MoM and 2.9% YoY. The final consumer sentiment index for August dropped to 58.2 as more Americans expected unemployment to rise in the year ahead. Inflation expectations ticked down only slightly from the preliminary reading, sitting at 4.8% for the next year. Consumer confidence also fell last month on concerns for job prospects. The second estimate of Q2 GDP was revised higher to +3.3% from +3.0%, reflecting upgrades in consumer spending and business investment. Looking forward, on Friday the Atlanta Fed pushed its Q3 GDPNow forecast up to +3.5% from +2.2% just a few days prior. This upgrade arrived despite the U.S. goods trade deficit widening significantly in July—which can be a drag on economic growth—as businesses ramped up imports ahead of the August tariff deadline. In housing news, new home sales fell in July while pending home sales were hurt by a spike in contract cancellations. Finally, late last week a federal judge set an expedited schedule in Fed Governor Cook’s bid to block President Trump from removing her from office. Overseas, French President Macron pledged support for Prime Minister Bayrou’s call for a confidence vote on September 8. The move could lead to a change in government and has rattled financial markets, pushing France’s borrowing costs higher. Elsewhere in Europe, Germany’s CPI rose to 2.2% YoY in August from 2.0% the prior month while core inflation stood at 2.7%. European central bankers were divided on inflation expectations according to minutes from their last meeting. Australia’s CPI spiked to 2.8% YoY in July from 1.9%, driven by a jump in electricity prices. Investors still anticipated an interest rate cut at the RBA meeting in November. Last of all, inflation in Japan’s capital slowed sharply to 2.5% last month, down from the 2.9% prior reading. Government utility subsidies drove the decrease, suggesting that overall inflation remained relatively unchanged.
THE WEEK AHEAD
Labor Day weekend marks the unofficial end of summer, and now investors will turn their attention to a shortened but busy week on Wall Street. The main economic release will be the U.S. non-farm payrolls report on Friday, while earlier in the week, other labor market data could provide additional color. This is likely the final test for an anticipated interest rate cut at the upcoming FOMC meeting. Consistent with the slowing trend, 75,000 new jobs are expected for August, with the unemployment rate forecasted to tick up to 4.3%. ISM manufacturing and services PMIs, factory orders, and revised Q2 productivity and unit labor costs round out the domestic agenda. Several FOMC member appearances dot the calendar, and semiconductor company Broadcom reports earnings on Thursday after the close. Overseas, the economic calendar is light. The Eurozone is set to release CPI and retail sales figures, while Germany has factory orders on the schedule. ECB President Lagarde and RBA Governor Bullock are each scheduled to speak at different events early Wednesday morning. Finally, Australia reports GDP data on Tuesday night.
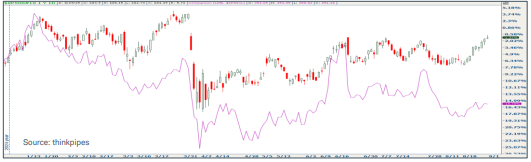
CHART OF THE WEEK
Energy cracks resistance
The S&P500 energy sector index ($SP500#10) has jumped nearly 7% in the past two weeks versus a more moderate 4% increase in oil prices (represented by the purple line on the graph below). The index is dominated by the oil producing majors, with Exxon Mobil, Chevron, and Conoco Phillips comprising nearly 50% of the market capitalization. The prospect of lower interest rates that has come to the fore following the Fed’s Jackson Hole symposium tends to boost the stocks in the energy sector more than the commodities themselves. Investors should keep in mind that the large oil-producing companies do more than just sell the product they pull out of the earth. They are also major refiners that track what’s called the “crack spread”, which measures the price difference between crude oil and the refined products such as gasoline and distillates. This spread has improved by between $6-8 per barrel in just the last two months, reflecting stronger demand for refined products like gasoline and diesel. This is a good sign for overall demand and means that operational profitability for energy companies has been improving. Market expectations are for higher earnings and cash flow to continue in the energy sector even if oil prices hold steady.
Source: Charles Schwab Corporation
IMPORTANT LEGAL NOTICE AND DISCLOSURE INFORMATION
Investment advisory service is provided by SVL Holding Corporation dba SVL Investments Management (“SVL”), a California registered investment advisor. Advisory services are subject to advisory fees as disclosed on Form ADV.
Investing involves risks, and investment decisions should be based on your own goals, time horizon, and tolerance for risk. The forecasts or forward-looking statements are based on assumptions, may not materialize, and are subject to revision without notice. International investments carry additional risks, which include differences in financial reporting standards, currency exchange rates, political risks unique to a specific country, foreign taxes and regulations, and the potential for illiquid markets.
Past performance may not be indicative of future results. Therefore, no current or prospective client should assume that future performance of any specific investment, investment strategy (including the investments and/or investment strategies recommended or undertaken by SVL) or product made reference to directly or indirectly by SVL in its web site, or indirectly via a link to an unaffiliated third party web site, will be profitable or equal the corresponding indicated performance level(s). Different types of investments involve varying degrees of risk, and there can be no assurance that the future performance of any specific investment, investment strategy, or product (including the investments and/or investment strategies recommended or undertaken by SVL), or any non-investment related content, made reference to directly or indirectly on this site will either be suitable or profitable for a client or prospective client’s investment portfolio. Historical performance results for investment indices and/or categories generally do not reflect the deduction of transaction and/or custodial charges, the deduction of an investment management fee, or the impact of taxes, the incurrence of which would have the effect of decreasing historical performance results for investment indices.
Certain portions of SVL‘s web site (i.e. blog, Insights, newsletters, articles, commentaries, etc.) may contain a discussion of, and/or provide access to, SVL‘s (and those of other investment and non-investment professionals) positions and/or recommendations as of a specific prior date. Due to various factors, including changing market conditions, such discussion may no longer be reflective of current position(s) and/or recommendation(s). Moreover, no client or prospective client should assume that any such discussion serves as the receipt of, or a substitute for, personalized advice from SVL or from any other investment professional. SVL is neither an attorney nor accountant, and no portion of the web site content should be interpreted as legal, accounting or tax advice.
Rankings and/or recognition by unaffiliated rating services and/or publications should not be construed by a client or prospective client as a guarantee that he/she will experience a certain level of results if SVL is engaged, or continues to be engaged, to provide investment advisory services, nor should it be construed as a current or past endorsement of SVL by any of its clients. Rankings published by magazines, and others, generally base their selections exclusively on information prepared and/or submitted by the recognized adviser.
To the extent that any client or prospective client utilizes any economic calculator or similar device contained within or linked to SVL‘s web site, the client and/or prospective client acknowledges and understands that the information resulting from the use of any such calculator/device, is not, and should not be construed, in any manner whatsoever, as the receipt of, or a substitute for, personalized individual advice from SVL, or from any other investment professional.
Each client and prospective client agrees, as a condition precedent to his/her/its access to SVL‘s web site, to release and hold harmless SVL, its officers, directors, owners, employees and agents from any and all adverse consequences resulting from any of his/her/its actions and/or omissions which are independent of his/her/its receipt of personalized individual advice from SVL.