

Weekly Newsletter August 31st to September 4th
RECAPPING LAST WEEK
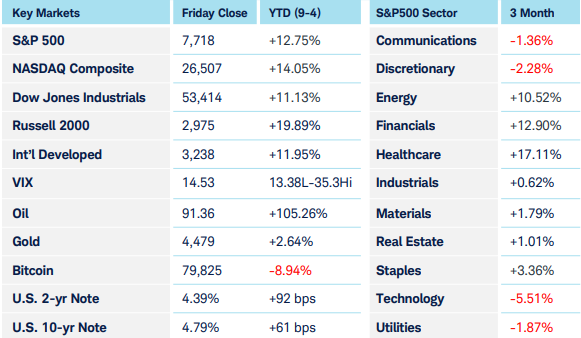
Global equity markets were quietly choppy this week as investors grappled with a rise in global bond yields, a renewed escalation in U.S.-Iranian hostilities and a shifting outlook for Fed policy. U.S. equities came under pressure early in the week as the global bond selloff and higher energy prices challenged elevated valuations, although stocks recovered as the week progressed, with the S&P 500, Nasdaq 100, and Russell 2000 posting modest gains of under a half a percent. The markets were ultimately awaiting the Friday release of the August employment report, which showed payrolls rising a robust 162k versus expectations of 55k along with a revision to July’s report to reflect growth in payrolls of 21k compared to the initially reported decline of 23k. The surprisingly strong report pushed market expectations for a 25 bps hike in the Fed Funds target rate to 58%. While U.S. Treasury yields were pretty much flat on the week, the bond selloff story took on an international focus with the 10-year Japanese Govt Bond moving above 3% for the first time since 1996 and similar-maturity German Bunds making 15-year highs. The increase in energy prices resulting from the resumption in military hostilities with Iran and the potential for inflationary pressures to be felt more “downstream” is most readily apparent in the price for diesel, which is near the highs seen during the early onset of the war. Alongside the inelastic steady demand from the global trucking and shipping industry, the seasonal marginal increase in demand resulting from Northern Hemisphere farmers preparing for the fall harvest and the roughly 17% of homes in the Northeast U.S. that utilize the fuel to heat their homes will be exposing those populations to the sticker shock. The refiners benefiting from “heat (diesel) crack” spreads of $100 a barrel led the Energy sector to be the week’s strongest performer amongst the S&P 500 sectors, with Consumer Discretionary correspondingly the worst, at up over 2% and down nearly 2%, respectively. The other macro sectors that we routinely address (currencies, precious metals, and crypto) all offered initial knee-jerk reactions to the increased expectation of a rate hike resulting from the strong jobs report but spent the rest of Friday’s session retracing most or all of it back. The most notable move in currencies saw the USD weaken against the Japanese Yen back to the lows seen in the immediate aftermath of the coordinated intervention. A daily chart of the USD/JPY very much reflects an “escalator up, elevator down” nature of certain markets.
THE WEEK AHEAD
For the 3 rd week in a row markets will have to wait until Friday for the main event. The CPI report, preceded by Thursday’s PPI report, will give market participants one final look at inflation data ahead of the Fed’s September 16th meeting. Stubbornly high energy prices combined with elevated yields on the long end of the curve and a 2-year that is trading 50 basis points above the effective Fed Funds rate are all the sort of market signals that reflect the Fed’s efforts to bring inflation down to its stated 2% target remain a work in progress. Whether geopolitical developments related to the Iranian situation escalate or diminish in the coming days/weeks/months remains the greatest of the known unknowns. However, the ever-present pricing of tail risk one sees embedded within short-term index option put skew always reminds us that it’s the unknown unknowns that have the potential to alter everything. Something that we’ll all be reflecting on as Friday will also commemorate the somber 25th anniversary of the September 11th terrorist attacks.
CHART OF THE WEEK
When Good Jobs Make Bad Bonds
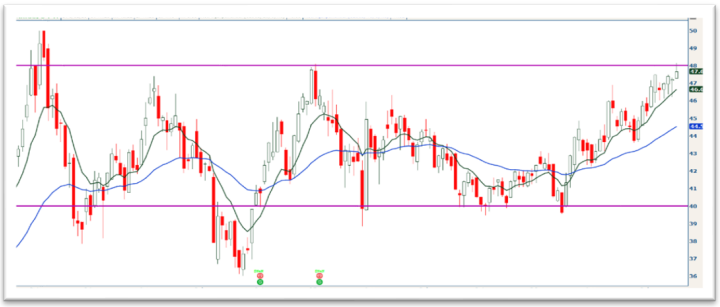
The CBOE 10-year Treasury yield index shown below represents 10 times the rate those notes are paying. Those yields have been mostly range-bound the last 3 years between 4-4.8%, but in the last year we’ve seen a steady drift to the top of that range. The main three factors driving that move have been strong economic data, rising inflation expectations, and a pile of government debt $40 trillion high and growing. As demand for Treasuries drops, the rates have to increase to attract more buyers, and now they have competition they’re not used to. There has always been a corporate bond market, but due to the enormous capex spending on the AI buildout, some of the largest companies on earth are playing bond salesmen too, absorbing some of the buyers traditionally in Treasuries. There was a brief reprieve on Thursday when Fed Governor Christopher Waller suggested that improving inflation could justify leaving rates alone at their September meeting, but August’s employment report on Friday sent them back up, briefly to a new 52-week high of 4.81%, and increased probability of that rate hike from 55% to 65% before retreating back to 60% by the end of the day. Inflation reports next week may be the deciding factor on whether that yield remains within its range or breaks resistance and moves towards 5%. Cooling inflation reports along with a retreat in oil prices could send rates lower, which would make equity markets very happy. Of course, that means that hotter inflation reports, especially if oil remains expensive, could stall out the rally we’ve gotten used to.
Source: Charles Schwab Corporation
IMPORTANT LEGAL NOTICE AND DISCLOSURE INFORMATION
Investment advisory service is provided by SVL Holding Corporation dba SVL Investments Management (“SVL”), a California registered investment advisor. Advisory services are subject to advisory fees as disclosed on Form ADV.
Investing involves risks, and investment decisions should be based on your own goals, time horizon, and tolerance for risk. The forecasts or forward-looking statements are based on assumptions, may not materialize, and are subject to revision without notice. International investments carry additional risks, which include differences in financial reporting standards, currency exchange rates, political risks unique to a specific country, foreign taxes and regulations, and the potential for illiquid markets.
Past performance may not be indicative of future results. Therefore, no current or prospective client should assume that future performance of any specific investment, investment strategy (including the investments and/or investment strategies recommended or undertaken by SVL) or product made reference to directly or indirectly by SVL in its web site, or indirectly via a link to an unaffiliated third party web site, will be profitable or equal the corresponding indicated performance level(s). Different types of investments involve varying degrees of risk, and there can be no assurance that the future performance of any specific investment, investment strategy, or product (including the investments and/or investment strategies recommended or undertaken by SVL), or any non-investment related content, made reference to directly or indirectly on this site will either be suitable or profitable for a client or prospective client’s investment portfolio. Historical performance results for investment indices and/or categories generally do not reflect the deduction of transaction and/or custodial charges, the deduction of an investment management fee, or the impact of taxes, the incurrence of which would have the effect of decreasing historical performance results for investment indices.
Certain portions of SVL‘s web site (i.e. blog, Insights, newsletters, articles, commentaries, etc.) may contain a discussion of, and/or provide access to, SVL‘s (and those of other investment and non-investment professionals) positions and/or recommendations as of a specific prior date. Due to various factors, including changing market conditions, such discussion may no longer be reflective of current position(s) and/or recommendation(s). Moreover, no client or prospective client should assume that any such discussion serves as the receipt of, or a substitute for, personalized advice from SVL or from any other investment professional. SVL is neither an attorney nor accountant, and no portion of the web site content should be interpreted as legal, accounting or tax advice.
Rankings and/or recognition by unaffiliated rating services and/or publications should not be construed by a client or prospective client as a guarantee that he/she will experience a certain level of results if SVL is engaged, or continues to be engaged, to provide investment advisory services, nor should it be construed as a current or past endorsement of SVL by any of its clients. Rankings published by magazines, and others, generally base their selections exclusively on information prepared and/or submitted by the recognized adviser.
To the extent that any client or prospective client utilizes any economic calculator or similar device contained within or linked to SVL‘s web site, the client and/or prospective client acknowledges and understands that the information resulting from the use of any such calculator/device, is not, and should not be construed, in any manner whatsoever, as the receipt of, or a substitute for, personalized individual advice from SVL, or from any other investment professional.
Each client and prospective client agrees, as a condition precedent to his/her/its access to SVL‘s web site, to release and hold harmless SVL, its officers, directors, owners, employees and agents from any and all adverse consequences resulting from any of his/her/its actions and/or omissions which are independent of his/her/its receipt of personalized individual advice from SVL.