

Weekly Newsletter August 3rd to August 7th
RECAPPING LAST WEEK
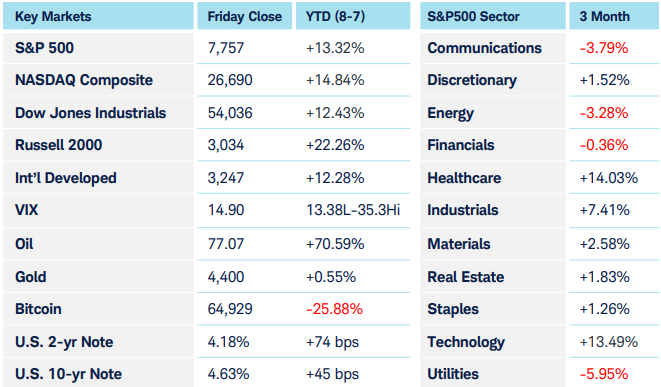
Global equity markets continued to push higher this week, with U.S. stocks extending their recent gains despite a sharp deterioration in labor-market data. The S&P 500 pushed into record highs as investors continued emphasizing strong corporate earnings despite growing evidence that the economy is slowing. The week also brought further signs of de-escalation in the Iran conflict, which helped pull oil prices lower while reducing some of the inflationary risk that had been weighing on markets. By the end of the week, though, a surprisingly weak July employment report shifted attention back to the U.S. economy: the data showed a loss of 23k jobs in July against market expectations of an 80k increase. The unemployment rate nonetheless ticked down to 4.1% from 4.2%, driven in part by a decline in labor force participation. Average hourly earnings also came in under even the low range of economists’ expectations, rising just .1% for the month and 3.2% year over year. The data reduced market expectations for a 25bps September rate hike to 44%. Meanwhile, equity markets remained buoyant, supported by strong corporate earnings. Aggregate earnings for S&P companies were up nearly 50% year over year. It’s worth noting, though, that outsized reports from a small number of components, like Alphabet’s $98B unrealized gain in the value of equity securities (notably its stake in SpaceX) and Amazon distorted those numbers somewhat. Removing these results delivers a still impressive but more understandable 28%. While investors are increasingly concerned about the hyperscalers’ enormous capital expenditures to buildout AI infrastructure, earnings season has reinforced the notion that corporate profitability is a significant tailwind for U.S. equities and has helped to rationalize current valuations. S&P 500 sector performance was led by Tech, up over 7%, while Energy was the laggard, down over 3%-- early in the week, when Treasury Secretary Bessent stated in a Tuesday interview that he believed a deal could be reached “today or tomorrow” regarding the Strait of Hormuz, prices dropped. When no deal emerged within that timeline, and Iranian state media claimed that any deal would still not permit Israeli or U.S. ships to pass through the strait, energy markets firmed up. The dollar remained under pressure in the aftermath of last week’s coordinated intervention to support the Yen which also provided the catalyst for other previously sleepy risk assets to finally catch a bid, most notably precious metals, led by gold making a 2-month high.
THE WEEK AHEAD
With over 75% of the S&P 500 having now reported quarterly results, we have a reassuring view into the health of corporate America. As a result, markets will enter the week focused primarily on upcoming inflation and consumer data. CPI, PPI, and retail sales will indicate whether the recent deterioration in hiring is being accompanied by a broader loss of economic momentum or whether the economy remains resilient. The July CPI report on Wednesday will be the week’s most important release. Headline CPI is expected to be 3.4% year over year, while core CPI is expected at 2.5%, the latter at least carrying the “handle” of the Fed’s inflation target. Thursday’s PPI will provide another indication of any inflationary pressures occurring further up the supply chain. Retail sales on Friday will be the key reading on the health of the consumer. That headline number will be influenced by gas prices which surged during the month, only moderating in the final week. Energy markets, driven by progress or lack thereof in opening the Strait of Hormuz, remain the wild card. A deal resulting in traffic flowing through the Strait, leading to an assumed drop in energy prices, combined with data supporting softer inflation and a resilient consumer would be an ideal foundation for a “risk-on” macro environment.
CHART OF THE WEEK
Houston, We Have Momentum
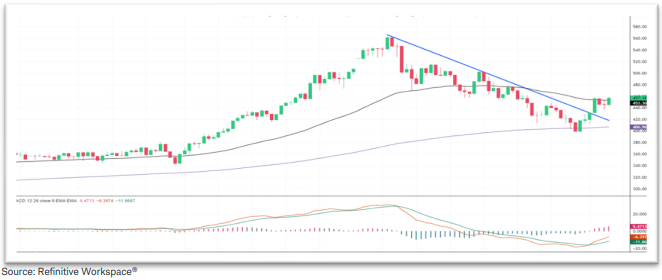
While SpaceX has thrown a spotlight on the space economy, the industry is much more than that one company. That stepped up last week with the release of SpaceX’s first earnings report as a public company, which showed quarterly revenue up 92% to $7.8 billion. Their AI-related capex spending was, however, more than double revenue at $15.8 billion, so shares fell 13.6% on the news. On Thursday, 911 million restricted shares became eligible for sale, which should have exerted further downward pressure. Instead, shares rallied 20%. As important as SPCX is to the industry, there are many other companies working in space and 58 of them are included in the BlueStar Space and Connective Technologies Index (BCNCT) shown below. SPCX is only 4% of the index, but when it rallies it pulls the entire sector higher. BCNCT rose 8% last week, indicating a reversal of the downtrend of the last two months. That 30% retreat was rough but found support at the 200-day exponential moving average, bounced from there and broke through down-sloping resistance and the 50-day moving average. A bullish MACD crossover accompanied the reversal, adding confidence this trend will last. The next level of resistance is $500, 11% above Friday’s close. It appears for now that the sellers are exhausted and space stocks’ path of least resistance is higher.
Source: Charles Schwab Corporation
IMPORTANT LEGAL NOTICE AND DISCLOSURE INFORMATION
Investment advisory service is provided by SVL Holding Corporation dba SVL Investments Management (“SVL”), a California registered investment advisor. Advisory services are subject to advisory fees as disclosed on Form ADV.
Investing involves risks, and investment decisions should be based on your own goals, time horizon, and tolerance for risk. The forecasts or forward-looking statements are based on assumptions, may not materialize, and are subject to revision without notice. International investments carry additional risks, which include differences in financial reporting standards, currency exchange rates, political risks unique to a specific country, foreign taxes and regulations, and the potential for illiquid markets.
Past performance may not be indicative of future results. Therefore, no current or prospective client should assume that future performance of any specific investment, investment strategy (including the investments and/or investment strategies recommended or undertaken by SVL) or product made reference to directly or indirectly by SVL in its web site, or indirectly via a link to an unaffiliated third party web site, will be profitable or equal the corresponding indicated performance level(s). Different types of investments involve varying degrees of risk, and there can be no assurance that the future performance of any specific investment, investment strategy, or product (including the investments and/or investment strategies recommended or undertaken by SVL), or any non-investment related content, made reference to directly or indirectly on this site will either be suitable or profitable for a client or prospective client’s investment portfolio. Historical performance results for investment indices and/or categories generally do not reflect the deduction of transaction and/or custodial charges, the deduction of an investment management fee, or the impact of taxes, the incurrence of which would have the effect of decreasing historical performance results for investment indices.
Certain portions of SVL‘s web site (i.e. blog, Insights, newsletters, articles, commentaries, etc.) may contain a discussion of, and/or provide access to, SVL‘s (and those of other investment and non-investment professionals) positions and/or recommendations as of a specific prior date. Due to various factors, including changing market conditions, such discussion may no longer be reflective of current position(s) and/or recommendation(s). Moreover, no client or prospective client should assume that any such discussion serves as the receipt of, or a substitute for, personalized advice from SVL or from any other investment professional. SVL is neither an attorney nor accountant, and no portion of the web site content should be interpreted as legal, accounting or tax advice.
Rankings and/or recognition by unaffiliated rating services and/or publications should not be construed by a client or prospective client as a guarantee that he/she will experience a certain level of results if SVL is engaged, or continues to be engaged, to provide investment advisory services, nor should it be construed as a current or past endorsement of SVL by any of its clients. Rankings published by magazines, and others, generally base their selections exclusively on information prepared and/or submitted by the recognized adviser.
To the extent that any client or prospective client utilizes any economic calculator or similar device contained within or linked to SVL‘s web site, the client and/or prospective client acknowledges and understands that the information resulting from the use of any such calculator/device, is not, and should not be construed, in any manner whatsoever, as the receipt of, or a substitute for, personalized individual advice from SVL, or from any other investment professional.
Each client and prospective client agrees, as a condition precedent to his/her/its access to SVL‘s web site, to release and hold harmless SVL, its officers, directors, owners, employees and agents from any and all adverse consequences resulting from any of his/her/its actions and/or omissions which are independent of his/her/its receipt of personalized individual advice from SVL.