
Weekly Newsletter August 4th to August 8th
RECAPPING LAST WEEK
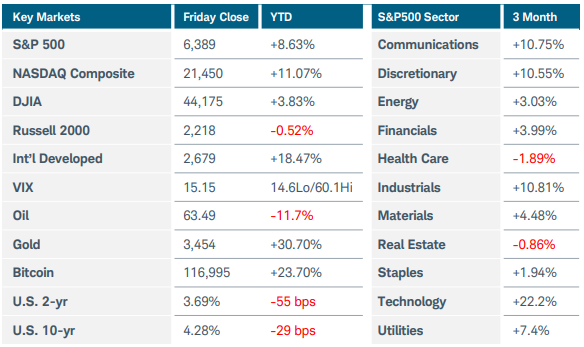
U.S. equities recovered from last week’s drop with modest gains despite further weakness in labor markets. The S&P500 and Russell 2000 rallied 2% while the NASDAQ Composite advanced 3.5%. Eight of eleven S&P500 sectors ended the week positive, but only 3 rose sufficiently to overcome the troubles from the prior week. Consumer discretionary and staples were the top two sectors, gaining 3% each, with technology close behind. Once again, healthcare was the worst performing sector, nearing 3-year lows. With the jobs market in focus from last week’s employment report, weekly jobless claims hit 226k, bringing continuing claims up to 1.974 million, the highest mark since 2021. Services sector activity stagnated, with the ISM Services PMI slipping to 50.1, barely holding onto expansion above 50. Q2 productivity however rebounded 2.4%, following a 1.8% decline in Q1. Consumer credit rose by $7.37 billion in June, and household debt reached a record $18.39 trillion. Government debt wasn’t very appealing either, with weak 10- and 30-year bond auctions. The Swiss President was in Washington, for an ultimately unsuccessful attempt to negotiate a trade deal. That failure to come to an agreement may have influenced President Trump’s decision to add gold to the tariffs that took effect this week; combined, those brought our blended rate to the highest level since 1934. Gold reached new all-time highs above $3,500/oz on the news. Stephen Miran, a noted bitcoin advocate, was appointed to fill the vacant seat at the Fed, and President Trump signed an executive order allowing private investments and crypto in 401k plans. Bitcoin gained 2.5%, but Ethereum was the winner gaining over 15%, hinting there may be an “alt season” after all. Earnings were mixed, with PLTR MCD and UBER rising, while AMD, DIS, SNAP, AND SMCI tumbled after their reports. AAPL rallied after stating intentions to add $100 billion in domestic investment on top of the $500 billion the company had already pledged—this move caused the administration to grant them an exception from tariffs on Indian made iPhones. India was in the President’s crosshairs after their continued purchases of Russian oil, but OPEC’s announced production hike brought prices back down from the spike the week before. Over in Europe, investor sentiment collapsed as the Sentix Index fell to -3.7, while industrial production in Germany dropped 1.9% in June, the lowest since May 2020. Producer prices rose 0.8% MoM and retail sales climbed 0.3%. The BOE had a split vote but still cut 25 basis points, bringing their rate to 4%. China’s Caixin Services PMI expanded at the fastest pace in 14 months, while Canada’s Ivey PMI rose to 55.8 its highest point in a year.
THE WEEK AHEAD
Inflation will be the focus of this week, along with the revolving door of potential trade deals, with several reports anticipated throughout the week. Here at home, expectations from the Cleveland Fed on Inflation arrive Monday and the US preliminary expectations come Friday, with CPI, PPI, and Import prices reports sprinkled between. Germany will release CPI as well. GDP figures and confidence surveys will make up a large portion of the data this week. MoM GDP form the UK, QoQ Flash GDP from the EU, and preliminary GDP from Japan all get released Thursday. The NFIB Small Biz Index, Empire St Mfg Index, and Preliminary Consumer Sentiment all from the US come out, with similar reports from abroad. German ZEW Economic Sentiment and Australia’s NAB Biz Confidence survey will indicate the mood of investors there. Australia has a lot going on this week, with a rate statement from the RBA, a wage price index report, as well as employment figures. Industrial production and retail sales numbers from both the US Thursday and China Friday round out the week. Unemployment claims may be more in focus than normal, considering the less-than-ideal numbers from both this week and last. Investors are looking for additional evidence indicating a September rate cut, though that meeting feels an eternity away after recent data.
CHART OF THE WEEK
Equal weights not equal
The S&P500 Equal Weight Index (SPXEW) depicted below managed to eek out a gain last week, along with its cap weighted counterpart (SPX) (shown in purple), but not by much. Cracks are showing in the strength of the trend in both, but as concentration continues to build at the top, behemoths from the Mag 7, especially NVDA, AAPL, and AMZN held up SPX much more than the equal weight index. The MACD studies are both above 0, and the RSI is above 40 on both indices, so the trend is still up. However, bearish divergences in the MACD are also showing in both cases, indicating weaker momentum. The weaker momentum is much more apparent in the equal-weighted index, with the MACD barely above 0 and the RSI just holding above 40. A break of either would indicate increased bearish momentum. And if such a break in the indicators were to accompany a break below technical support at $7,300 on price, further downside would be more likely. There has been surprisingly little back-and-forth price action since the lows in April, so a retracement could be a welcome reset, and set up the next rally.
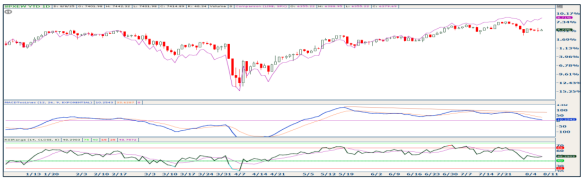
Source: Charles Schwab Corporation
IMPORTANT LEGAL NOTICE AND DISCLOSURE INFORMATION
Investment advisory service is provided by SVL Holding Corporation dba SVL Investments Management (“SVL”), a California registered investment advisor. Advisory services are subject to advisory fees as disclosed on Form ADV.
Investing involves risks, and investment decisions should be based on your own goals, time horizon, and tolerance for risk. The forecasts or forward-looking statements are based on assumptions, may not materialize, and are subject to revision without notice. International investments carry additional risks, which include differences in financial reporting standards, currency exchange rates, political risks unique to a specific country, foreign taxes and regulations, and the potential for illiquid markets.
Past performance may not be indicative of future results. Therefore, no current or prospective client should assume that future performance of any specific investment, investment strategy (including the investments and/or investment strategies recommended or undertaken by SVL) or product made reference to directly or indirectly by SVL in its web site, or indirectly via a link to an unaffiliated third party web site, will be profitable or equal the corresponding indicated performance level(s). Different types of investments involve varying degrees of risk, and there can be no assurance that the future performance of any specific investment, investment strategy, or product (including the investments and/or investment strategies recommended or undertaken by SVL), or any non-investment related content, made reference to directly or indirectly on this site will either be suitable or profitable for a client or prospective client’s investment portfolio. Historical performance results for investment indices and/or categories generally do not reflect the deduction of transaction and/or custodial charges, the deduction of an investment management fee, or the impact of taxes, the incurrence of which would have the effect of decreasing historical performance results for investment indices.
Certain portions of SVL‘s web site (i.e. blog, Insights, newsletters, articles, commentaries, etc.) may contain a discussion of, and/or provide access to, SVL‘s (and those of other investment and non-investment professionals) positions and/or recommendations as of a specific prior date. Due to various factors, including changing market conditions, such discussion may no longer be reflective of current position(s) and/or recommendation(s). Moreover, no client or prospective client should assume that any such discussion serves as the receipt of, or a substitute for, personalized advice from SVL or from any other investment professional. SVL is neither an attorney nor accountant, and no portion of the web site content should be interpreted as legal, accounting or tax advice.
Rankings and/or recognition by unaffiliated rating services and/or publications should not be construed by a client or prospective client as a guarantee that he/she will experience a certain level of results if SVL is engaged, or continues to be engaged, to provide investment advisory services, nor should it be construed as a current or past endorsement of SVL by any of its clients. Rankings published by magazines, and others, generally base their selections exclusively on information prepared and/or submitted by the recognized adviser.
To the extent that any client or prospective client utilizes any economic calculator or similar device contained within or linked to SVL‘s web site, the client and/or prospective client acknowledges and understands that the information resulting from the use of any such calculator/device, is not, and should not be construed, in any manner whatsoever, as the receipt of, or a substitute for, personalized individual advice from SVL, or from any other investment professional.
Each client and prospective client agrees, as a condition precedent to his/her/its access to SVL‘s web site, to release and hold harmless SVL, its officers, directors, owners, employees and agents from any and all adverse consequences resulting from any of his/her/its actions and/or omissions which are independent of his/her/its receipt of personalized individual advice from SVL.