
Weekly Newsletter February 9th to February 13th
RECAPPING LAST WEEK
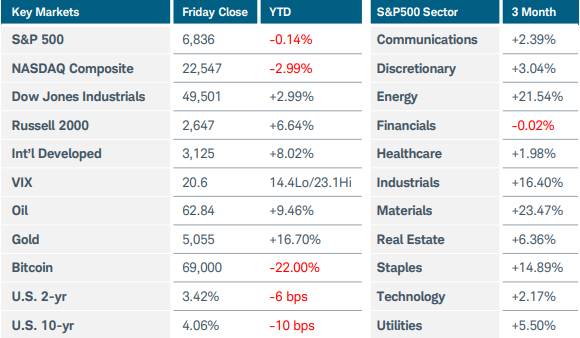
U.S. equity indices fell as fears of disruption from artificial intelligence continued to weigh on investor sentiment, even as economic data suggested that several interest rate cuts are still likely in 2026. The Nasdaq Composite dropped more than 2%, while the S&P500 slid 1.4% and the Russell 2000 ended lower by nearly 1%. At the sector level, financials were hit hardest by the AI turmoil, tumbling 5%, while the rate-sensitive and defensive utilities sector jumped 7%. Gold and silver remained volatile but ended the week little changed, while crude oil slipped more than 1% as U.S.-Iran tensions eased and traders speculated that OPEC may resume output increases soon. A significant slide in U.S. Treasury yields was only briefly interrupted by a stronger-than expected January jobs report. The 10-year yield sank 15 basis points to 4.06% after the inflation outlook improved. Consumer prices rose 0.2% last month, less than forecast. The YoY increased slowed to 2.4% from 2.7%, partially due to past higher readings dropping from the calculation. Delayed retail sales data from December registered an unexpected flat reading, potentially putting consumer spending on a slower growth path heading into 2026. This news, along with the softer CPI report, supported prospects of at least two interest rate cuts from the Federal Reserve this year. However, fed funds futures still pointed towards the first decrease not arriving until June at the earliest. January’s non-farm payrolls increased by 130,000 and the unemployment rate ticked down to 4.3%, backing the Fed’s recent statement that the labor market has shown signs of stabilization. In other U.S. economic news, the New York Fed’s latest Survey of Consumer Expectations saw one-year inflation expectations fall to 3.1% from 3.4% while some concerns about the jobs market abated. The Employment Cost Index slowed unexpectedly in Q4 2025 as softening demand for labor restrained wage gains. Existing home sales last month sank to the lowest level in more than two years. While affordability conditions improved for homebuyers due to wage gains and lower mortgage rates, supply remained constrained and lifted the median existing home price to $396,800. Overseas, Japanese stocks soared to record highs and the yen rallied after Prime Minister Takaichi’s ruling party scored a decisive victory in last weekend’s lower house elections. The result improved chances for economic stimulus measures at the core of the new government’s policy transition. In China, consumer inflation rose less than forecast at 0.2% in January while deflation in producer prices persisted. Last of all, Britain’s economic growth stagnated in the final quarter of 2025, rising just 0.1% and increasing odds for a rate cut in March.
THE WEEK AHEAD
Volatility may remain elevated as investors consider which industry might next experience an AI driven selloff after recent losses across the software, insurance, financial, and transportation spaces. The VIX settled at 20.6 on Friday, its highest weekly close this year. U.S. markets were closed Monday for the Presidents Day holiday, leaving a shortened week to squeeze in a multitude of economic data. The long-awaited first estimate of Q4 GDP arrives on Friday along with the delayed PCE price index from December. Consensus estimates are calling for around 3% GDP growth to end 2025, but the Atlanta Fed projection of 3.7% puts an upside surprise on the table, which could affect rate cut forecasts. Minutes from the last FOMC meeting will be released on Wednesday, and recent comments from committee members have confirmed that most are comfortable waiting before deciding on further reductions. Other releases on the U.S. calendar include this month’s flash PMI surveys, multiple housing data points, and trade balance figures. Retail giant Walmart will report earnings on Thursday before market open. On the international side, the UK has inflation, employment, and retail sales updates on the docket, while the flash PMIs are the main event for the rest of Europe. In Japan, stock market and currency rallies could extend while giving the central bank more fuel for rate hikes if the Q4 GDP estimate shows a bounce back from the prior quarter’s contraction.
CHART OF THE WEEK
Equal is not the same
The S&P500 index (SPX) has been treading water so far in 2026, trading in a tight 200-point wide channel between $6,800 and $7,000 and unable to break out in either direction. Due to the market cap-weighting structure of the index it is significantly influenced by the largest stocks. For example, Microsoft and Amazon have both experienced 20% drops already this year, which accounts for nearly 10% of the overall performance of SPX. Meanwhile, the S&P500 Equal Weight index (SPXEW) is up nearly 6% this year, illustrated in the chart below with a comparison to SPX (purple line). From a technical perspective, SPXEW has had consistent positive momentum since November, with a series of higher highs and higher lows in the MACD indicator. The RSI indicator hasn’t dropped below 50 since Thanksgiving. Both are supportive of expanding breadth and a healthy broad-based rally occurring beneath the surface. SPXEW keeps pushing to record highs each week while SPX is being held back by the poor performance of a handful of mega-cap technology companies. With international stocks and U.S. small and mid-caps also off to flying start this year, it may only be a matter of time until SPX chases its equal-weight counterpart. Investors await a breakout from the range for clues as to the next trend direction for SPX.
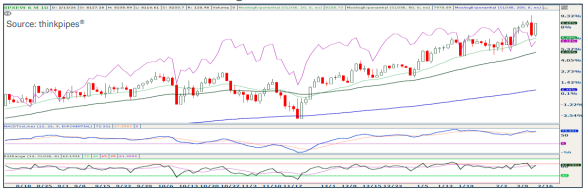
Source: Charles Schwab Corporation
IMPORTANT LEGAL NOTICE AND DISCLOSURE INFORMATION
Investment advisory service is provided by SVL Holding Corporation dba SVL Investments Management (“SVL”), a California registered investment advisor. Advisory services are subject to advisory fees as disclosed on Form ADV.
Investing involves risks, and investment decisions should be based on your own goals, time horizon, and tolerance for risk. The forecasts or forward-looking statements are based on assumptions, may not materialize, and are subject to revision without notice. International investments carry additional risks, which include differences in financial reporting standards, currency exchange rates, political risks unique to a specific country, foreign taxes and regulations, and the potential for illiquid markets.
Past performance may not be indicative of future results. Therefore, no current or prospective client should assume that future performance of any specific investment, investment strategy (including the investments and/or investment strategies recommended or undertaken by SVL) or product made reference to directly or indirectly by SVL in its web site, or indirectly via a link to an unaffiliated third party web site, will be profitable or equal the corresponding indicated performance level(s). Different types of investments involve varying degrees of risk, and there can be no assurance that the future performance of any specific investment, investment strategy, or product (including the investments and/or investment strategies recommended or undertaken by SVL), or any non-investment related content, made reference to directly or indirectly on this site will either be suitable or profitable for a client or prospective client’s investment portfolio. Historical performance results for investment indices and/or categories generally do not reflect the deduction of transaction and/or custodial charges, the deduction of an investment management fee, or the impact of taxes, the incurrence of which would have the effect of decreasing historical performance results for investment indices.
Certain portions of SVL‘s web site (i.e. blog, Insights, newsletters, articles, commentaries, etc.) may contain a discussion of, and/or provide access to, SVL‘s (and those of other investment and non-investment professionals) positions and/or recommendations as of a specific prior date. Due to various factors, including changing market conditions, such discussion may no longer be reflective of current position(s) and/or recommendation(s). Moreover, no client or prospective client should assume that any such discussion serves as the receipt of, or a substitute for, personalized advice from SVL or from any other investment professional. SVL is neither an attorney nor accountant, and no portion of the web site content should be interpreted as legal, accounting or tax advice.
Rankings and/or recognition by unaffiliated rating services and/or publications should not be construed by a client or prospective client as a guarantee that he/she will experience a certain level of results if SVL is engaged, or continues to be engaged, to provide investment advisory services, nor should it be construed as a current or past endorsement of SVL by any of its clients. Rankings published by magazines, and others, generally base their selections exclusively on information prepared and/or submitted by the recognized adviser.
To the extent that any client or prospective client utilizes any economic calculator or similar device contained within or linked to SVL‘s web site, the client and/or prospective client acknowledges and understands that the information resulting from the use of any such calculator/device, is not, and should not be construed, in any manner whatsoever, as the receipt of, or a substitute for, personalized individual advice from SVL, or from any other investment professional.
Each client and prospective client agrees, as a condition precedent to his/her/its access to SVL‘s web site, to release and hold harmless SVL, its officers, directors, owners, employees and agents from any and all adverse consequences resulting from any of his/her/its actions and/or omissions which are independent of his/her/its receipt of personalized individual advice from SVL.