

Weekly Newsletter July 13th to July 17th
RECAPPING LAST WEEK
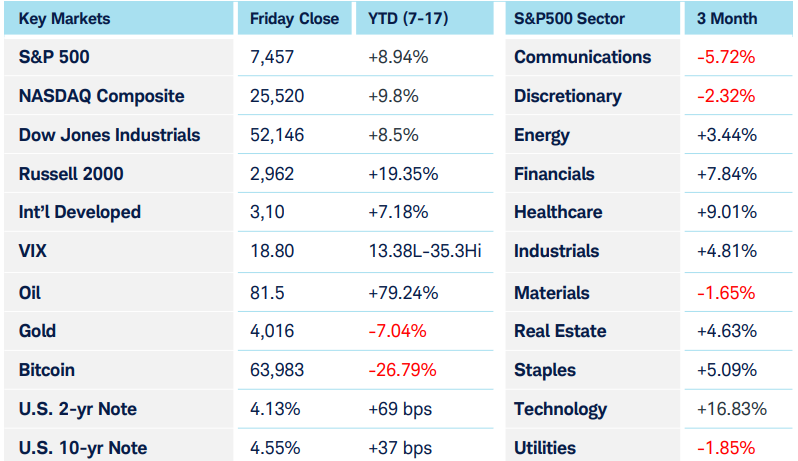
A sharp selloff in global memory chip stocks accelerated through the week, sparking concerns over the sustainability of the artificial intelligence investment cycle, while renewed hostilities in the Middle East and shifting Federal Reserve expectations drove broad sector rotation across global equity markets. A glance at the S&P 500’s recent performance would indicate we’re in the summer doldrums, beneath the surface, though underlying market action reflected significant sector rotation. For proof, look no farther than option pricing, where the spread between the average implied volatility of individual equities compared to the S&P 500 (VIXEQ-VIX) has hit a record high. The move underscores a market increasingly driven by company and sector-specific factors rather than broad macroeconomic themes. Nonetheless, investors did pay attention when Fed Chair Warsh gave his first Humphrey-Hawkins testimony to Congress: he reiterated the central bank’s commitment to restoring price stability, emphasizing that policymakers have “no tolerance” for persistently elevated inflation, but provided no explicit guidance regarding the timing of future interest rate decisions. Fed Funds futures pricing now reflects only a 10% chance of a 25-bps hike at the July 29th meeting, down from 30% only a week ago. This change resulted from the release of CPI and PPI reports that showed inflationary pressures easing. This data lent some support to Treasuries, which also benefited from Friday’s equity selloff. Nonetheless, yields remained above 4.5% on the 10 year and 5% on the 30 year, levels which caused some consternation when they were first breached mid-May. Hostilities escalated between the U.S. and Iran, keeping shipping through the Strait of Hormuz constrained-and crude oil above $80 per barrel. Although oil remains well below the $120 it spiked to early in the war; refined products—especially diesel—are a different story, much closer to their wartime highs than the lows they saw in late June. The elevated refining margins reflected in the crack spreads* led the S&P 500 Energy sector to rally 5% on the week while Technology lost a similar amount. This spread can serve as a loose proxy for refining margins and is now over $90 per barrel. Other macro sectors like currencies, precious metals and crypto saw quiet consolidation, sitting on the sidelines while the equity intramarket churn remained the dominant theme.
THE WEEK AHEAD
U.S equity markets will turn their attention to the heart of second-quarter earnings season, as results broaden beyond the major banks and begin to offer a clearer picture of the health of corporate America. Market watchers will focus on technology and semiconductor companies following last week’s sharp selloff in memory chip stocks. Highlights include Alphabet on Tuesday, Tesla on Wednesday and Intel on Thursday. As earnings season accelerates, markets will increasingly reward companies that exceed expectations and provide optimistic forward guidance while punishing even modest disappointments, which should continue the trend of elevated volatility in single stocks contrasted against the broader indices. On the international economic calendar, inflation data in the form of CPI numbers are released for Canada on Tuesday and the UK on Wednesday. The European Central Bank is widely expected to hold rates steady on Thursday. Friday sees the release of PMI data from the U.S. and a host of other major economic powers. The domestic calendar is otherwise light, though new home sales also come out Friday. Of course, investors will also be on the lookout for any unexpected developments in the Middle East.
CHART OF THE WEEK
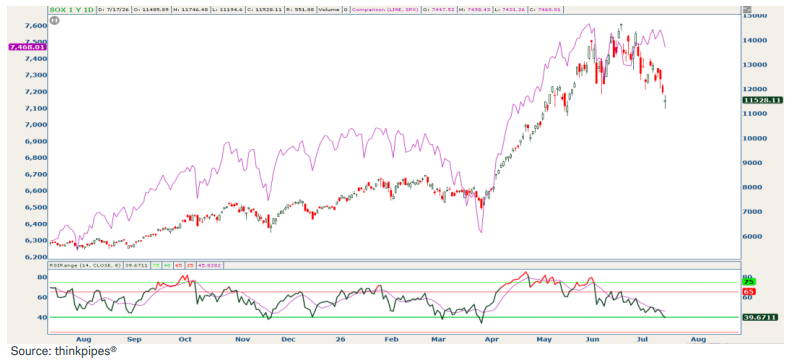
The SOX got Knocked Off
The PHLX Semiconductor Index (SOX) has been driving equity markets higher for quite some time but the acceleration at the end of March was sharp. SOX doubled in price during its March-toJune rally, but over the three weeks since its top has lost 20%. This is, of course, a sizeable drop, but still leaves the index up 100% YoY and 65% higher than its March low. The RSI indicator below the chart is still holding above its 40 line, a common support level in bullish trends. Semiconductors have historically been a leading area of equity markets, sitting at the front end of the technology supply chain. That fact is clear in the comparison chart below with SOX in candles and SPX in the purple line. The notable difference now is the resilience SPX has shown in the face of a 20% drop in SOX. From the date SOX topped SPX is flat. That’s a clear sign that capital isn’t leaving the equity markets or rushing towards risk-off investments–it’s simply rotating within the stock market, and even within the tech sector. SOX has grown from 4% of the S&P500 in 2020 to 19% today. For comparison, the second largest sector in the broader S&P 500 behind technology, is financials comprising 12.2%. A flat return in the S&P500 when its most important components struggle is impressive.
Source: Charles Schwab Corporation
IMPORTANT LEGAL NOTICE AND DISCLOSURE INFORMATION
Investment advisory service is provided by SVL Holding Corporation dba SVL Investments Management (“SVL”), a California registered investment advisor. Advisory services are subject to advisory fees as disclosed on Form ADV.
Investing involves risks, and investment decisions should be based on your own goals, time horizon, and tolerance for risk. The forecasts or forward-looking statements are based on assumptions, may not materialize, and are subject to revision without notice. International investments carry additional risks, which include differences in financial reporting standards, currency exchange rates, political risks unique to a specific country, foreign taxes and regulations, and the potential for illiquid markets.
Past performance may not be indicative of future results. Therefore, no current or prospective client should assume that future performance of any specific investment, investment strategy (including the investments and/or investment strategies recommended or undertaken by SVL) or product made reference to directly or indirectly by SVL in its web site, or indirectly via a link to an unaffiliated third party web site, will be profitable or equal the corresponding indicated performance level(s). Different types of investments involve varying degrees of risk, and there can be no assurance that the future performance of any specific investment, investment strategy, or product (including the investments and/or investment strategies recommended or undertaken by SVL), or any non-investment related content, made reference to directly or indirectly on this site will either be suitable or profitable for a client or prospective client’s investment portfolio. Historical performance results for investment indices and/or categories generally do not reflect the deduction of transaction and/or custodial charges, the deduction of an investment management fee, or the impact of taxes, the incurrence of which would have the effect of decreasing historical performance results for investment indices.
Certain portions of SVL‘s web site (i.e. blog, Insights, newsletters, articles, commentaries, etc.) may contain a discussion of, and/or provide access to, SVL‘s (and those of other investment and non-investment professionals) positions and/or recommendations as of a specific prior date. Due to various factors, including changing market conditions, such discussion may no longer be reflective of current position(s) and/or recommendation(s). Moreover, no client or prospective client should assume that any such discussion serves as the receipt of, or a substitute for, personalized advice from SVL or from any other investment professional. SVL is neither an attorney nor accountant, and no portion of the web site content should be interpreted as legal, accounting or tax advice.
Rankings and/or recognition by unaffiliated rating services and/or publications should not be construed by a client or prospective client as a guarantee that he/she will experience a certain level of results if SVL is engaged, or continues to be engaged, to provide investment advisory services, nor should it be construed as a current or past endorsement of SVL by any of its clients. Rankings published by magazines, and others, generally base their selections exclusively on information prepared and/or submitted by the recognized adviser.
To the extent that any client or prospective client utilizes any economic calculator or similar device contained within or linked to SVL‘s web site, the client and/or prospective client acknowledges and understands that the information resulting from the use of any such calculator/device, is not, and should not be construed, in any manner whatsoever, as the receipt of, or a substitute for, personalized individual advice from SVL, or from any other investment professional.
Each client and prospective client agrees, as a condition precedent to his/her/its access to SVL‘s web site, to release and hold harmless SVL, its officers, directors, owners, employees and agents from any and all adverse consequences resulting from any of his/her/its actions and/or omissions which are independent of his/her/its receipt of personalized individual advice from SVL.