

Weekly Newsletter July 20th to July 24th
RECAPPING LAST WEEK
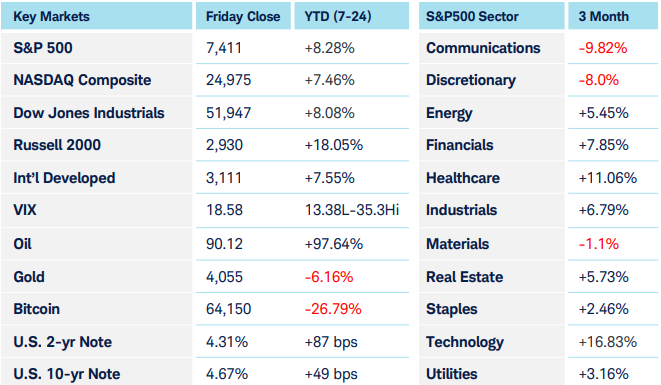
The dominant theme in U.S. equity markets last week was the sharp repricing of hyperscalers, prompted by investors showing little tolerance for rising capital expenditures tied to AI infrastructure. The semiconductor sector, which has been one of the primary beneficiaries of those capital outlays, regained its footing after bearing the brunt of the market’s punishment in the preceding week. The sharp rotation that we’ve been highlighting amongst sectors now is most dramatic within the tech sector itself. Earlier in the year featured AI stocks vs traditional software while now the focus is on chipmakers and their customers with a seemingly unsatiable appetite, the hyperscalers. World benchmark Brent crude oil pushed through $100 per barrel on Thursday before backing off a little on Friday as hostilities between the U.S. and Iran threatened not only to continue, but potentially to escalate. Refining margins, as measured through crack spreads, remained elevated, which led the Energy sector to rally over 3% on the week. That made it the best performer, while the Consumer Discretionary sector was the worst, falling over 5%. While this seems like a clear cause-and-effect scenario, remember that Consumer Discretionary has a fair amount of “big tech” in it, given its two largest components are Amazon and Tesla. The worrisome rise in energy prices spilled over to other sectors, and led Treasury yields to rise across the curve and the dollar caught a bid, most notably against the Yen. The widening interest rate differentials between the U.S and Japan overrode short-term traders fears of BOJ intervention and fueled carry trades. You’ll recall that the release of June’s benign inflation data the preceding week comforted the markets, with Fed Fund futures pricing reducing the chance of a July rate hike to 10%. Last week’s turmoil removed that comfort, with Fed Fund futures once again suggesting a 1 in 3 chance that the Open Market Committee could hike rates at the July 29th meeting. Friday also saw President Trump replace his expiring global 10% tariffs with a new program, that charges either a 12.5% or 10% rate depending on the target country/trading block’s policies regarding the import of goods produced by forced labor. This policy leverages a section of U.S. code that the administration believes will better withstand judicial challenges. Precious metals and crypto each caught a little bid early in the week only to give back most (metals) or all (crypto) of these gains by the end of the week, as global instability and higher U.S. interest rates supporting the dollar acted as countervailing forces.
THE WEEK AHEAD
Investors enter one of the most consequential weeks of the summer with two dominant catalysts competing for attention: the heart of second-quarter earnings season and the Fed’s July policy meeting. Next week’s results will help determine whether the market’s recent rotation away from AI leaders is temporary or if it marks the beginning of broader market leadership. More than 1/3 of the S&P 500 is scheduled to report, marking the busiest week of the earnings calendar. Megacap tech highlights include Microsoft and Meta on Wednesday followed by Apple and Amazon on Thursday. Alphabet and Tesla demonstrated that strong earnings alone are no longer sufficient to satisfy investors, as markets remain focused on AI infrastructure and capital expenditure plans. Outside of tech, investors will also digest results from a wide swath of the market, providing a broad read on consumer spending, industrial activity, healthcare demand and energy in a quarter in which elevated energy prices only eased in the final two weeks of June. If the Fed holds rates steady at Wednesday’s meeting, an outcome which the market currently is pricing at 65%, Fed watchers will scrutinize both the committee’s statement and Chair Kevin Warsh’s press conference for any indications of how renewed strength in energy prices and the demand pressures from the AI buildout have affected the likelihood for tightening at the September meeting, a prospect already priced at 80%. Finally, the potential for increased hostilities between Iran and the U.S. will remain the most closely watched geopolitical event.
CHART OF THE WEEK
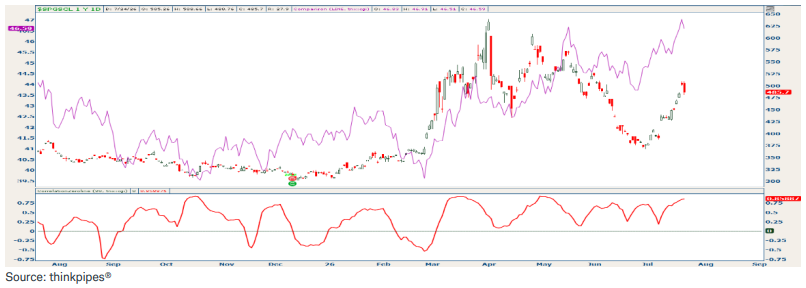
Oil Takes on the Fed
Oil prices shown by the S&P Crude Oil Index ($SPGSCL) in candles below climbed nearly 15% early last week before cutting that gain in half on Friday. Escalating tensions with Iran had markets pricing in a worst-case scenario around oil supply disruptions through the Strait of Hormuz. Yes, again. As concerning as that may be, those fears currently seem overblown, as ships are still getting through. Profit-taking at technical resistance also played a part, as Brent Crude hit the clean $100 mark before Fridays drop. U.S. Treasury yields (shown by the 10-year in purple) followed a similar path. Geopolitical tensions often lead to a flight to safety, which tends to help bond markets, but in this case oil spike-related inflation implications overrode this tendency. The correlation study below the chart depicts the increasingly positive correlation between oil and the 10-year yield, which is now above 85%. Higher oil prices are not helpful on the inflation front and could potentially influence Fed policy right before a FOMC meeting. Despite these headwinds, equity prices have held up, with the S&P500 sitting less than 3% below its all-time high. Volatility surrounding the Iranian situation is likely to continue but most market participants still believe its impact will be temporary, not a longterm supply shock. Confirmed progress toward a resolution of that situation could bring both oil and the 10-year yield back down just as fast they rose, which would ease financial conditions and release their hold on stocks.
Source: Charles Schwab Corporation
IMPORTANT LEGAL NOTICE AND DISCLOSURE INFORMATION
Investment advisory service is provided by SVL Holding Corporation dba SVL Investments Management (“SVL”), a California registered investment advisor. Advisory services are subject to advisory fees as disclosed on Form ADV.
Investing involves risks, and investment decisions should be based on your own goals, time horizon, and tolerance for risk. The forecasts or forward-looking statements are based on assumptions, may not materialize, and are subject to revision without notice. International investments carry additional risks, which include differences in financial reporting standards, currency exchange rates, political risks unique to a specific country, foreign taxes and regulations, and the potential for illiquid markets.
Past performance may not be indicative of future results. Therefore, no current or prospective client should assume that future performance of any specific investment, investment strategy (including the investments and/or investment strategies recommended or undertaken by SVL) or product made reference to directly or indirectly by SVL in its web site, or indirectly via a link to an unaffiliated third party web site, will be profitable or equal the corresponding indicated performance level(s). Different types of investments involve varying degrees of risk, and there can be no assurance that the future performance of any specific investment, investment strategy, or product (including the investments and/or investment strategies recommended or undertaken by SVL), or any non-investment related content, made reference to directly or indirectly on this site will either be suitable or profitable for a client or prospective client’s investment portfolio. Historical performance results for investment indices and/or categories generally do not reflect the deduction of transaction and/or custodial charges, the deduction of an investment management fee, or the impact of taxes, the incurrence of which would have the effect of decreasing historical performance results for investment indices.
Certain portions of SVL‘s web site (i.e. blog, Insights, newsletters, articles, commentaries, etc.) may contain a discussion of, and/or provide access to, SVL‘s (and those of other investment and non-investment professionals) positions and/or recommendations as of a specific prior date. Due to various factors, including changing market conditions, such discussion may no longer be reflective of current position(s) and/or recommendation(s). Moreover, no client or prospective client should assume that any such discussion serves as the receipt of, or a substitute for, personalized advice from SVL or from any other investment professional. SVL is neither an attorney nor accountant, and no portion of the web site content should be interpreted as legal, accounting or tax advice.
Rankings and/or recognition by unaffiliated rating services and/or publications should not be construed by a client or prospective client as a guarantee that he/she will experience a certain level of results if SVL is engaged, or continues to be engaged, to provide investment advisory services, nor should it be construed as a current or past endorsement of SVL by any of its clients. Rankings published by magazines, and others, generally base their selections exclusively on information prepared and/or submitted by the recognized adviser.
To the extent that any client or prospective client utilizes any economic calculator or similar device contained within or linked to SVL‘s web site, the client and/or prospective client acknowledges and understands that the information resulting from the use of any such calculator/device, is not, and should not be construed, in any manner whatsoever, as the receipt of, or a substitute for, personalized individual advice from SVL, or from any other investment professional.
Each client and prospective client agrees, as a condition precedent to his/her/its access to SVL‘s web site, to release and hold harmless SVL, its officers, directors, owners, employees and agents from any and all adverse consequences resulting from any of his/her/its actions and/or omissions which are independent of his/her/its receipt of personalized individual advice from SVL.