
Weekly Newsletter June 1st to June 5th
RECAPPING LAST WEEK
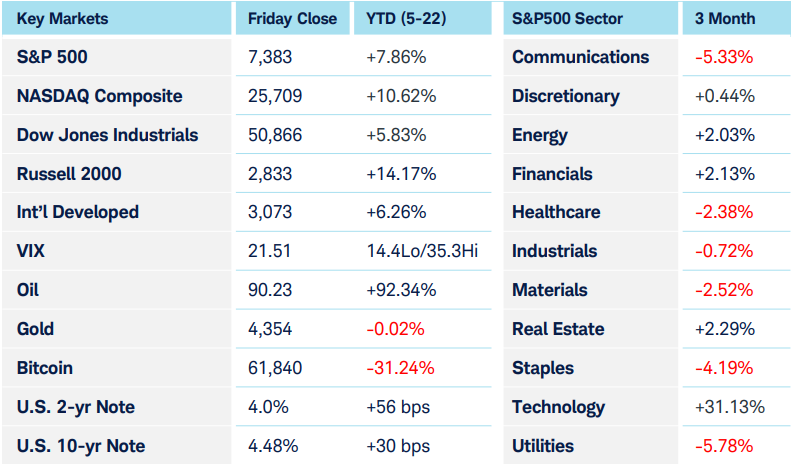
U.S. equities began the week with a continuation of the relentless semiconductor led rally that propelled all the major averages into new highs until a dramatic mid-week sector rotation occurred. The catalyst, Broadcom’s earnings. While yet another chipmaker announcing record earnings came as no surprise to market observers, the lack of providing forward-looking revenue guidance that only matched rather than blowing away analyst expectations led to not just a 12.5% drop in that stock but a rotation out of some of its high flying peers into names that drove both the Russell 2000 and the DJIA into record highs on Thursday. U.S. Treasuries patiently awaited the release of Friday’s U.S. non-farm payrolls report, with the long end of the curve hovering beneath psychologically important yield levels until breaking through 4.5% in the 10 year and 5.0% in the 30 year in the immediate aftermath of the report. Job growth came in at 172k, exceeding both analyst expectations and 100k for three months in a row while the unemployment rate held steady at 4.3% due to an expanding labor force. The U.S. dollar rallied against major currencies as a resilient U.S. economy, supported by a strong labor market with no prospect for rate cuts on the horizon, contrasted against the Eurozone dealing with stagflation upon data being released that showed 1st Quarter GDP of -.3%. The dollar rally also drove precious metal prices lower with gold and silver making multi-week lows. Crude oil prices firmed as the market hopes for an imminent resolution were complicated by an escalation in Israel’s conflict with Hezbollah in Lebanon. Crypto’s decline accelerated, fueled not just by the rotation into high flying tech stocks but the revelation that Michael Saylor’s Strategy (MSTR), one of the biggest crypto hoarders, announced a sale of $2.5M worth of Bitcoin, apparently just to fund a distribution on it’s preferred stock, but nonetheless a signal that added further pressure to the sector.
THE WEEK AHEAD
With a global economy and markets still digesting the effects of elevated energy prices, the market will turn its attention to plenty of inflation related economic data this week. Sunday evening, (early Monday in Japan), sees the release of the Japanese GDP price index and Tuesday evening sees the release of Japanese PPI along with Chinese CPI and PPI. The Japanese Yen had been under pressure due to their reliance on dollar denominated energy imports, with the Ministry of Finance directing the Bank of Japan to sell upwards of $73B to support the Yen. Currency markets will be on the lookout if intervention resumes as late Friday the USD/JPY moved firmly through the 160 level where the BOJ had been a seller. On Wednesday U.S. CPI is released followed by PPI on Thursday, numbers which not only dashed any expectations of rate cuts upon their release last month but firmly priced in expectations of hikes by year end. Friday offers a look at French and German CPI, while the inflation data culminates with the release of the University of Michigan Consumer Sentiment number along with Inflation Expectations. U.S. equity market resilience will be tested by whether the late week selloff in chip stocks merely offers a continued rotation into broader swaths of the market or if higher rates, energy prices, and a resumption of hostilities with Iran all becomes a little too much. Oh, our astute readers are surely aware that there’s an IPO expected on Friday, but that’s about all we can say.
CHART OF THE WEEK
Healthcare’s diagnosis becoming more conclusive
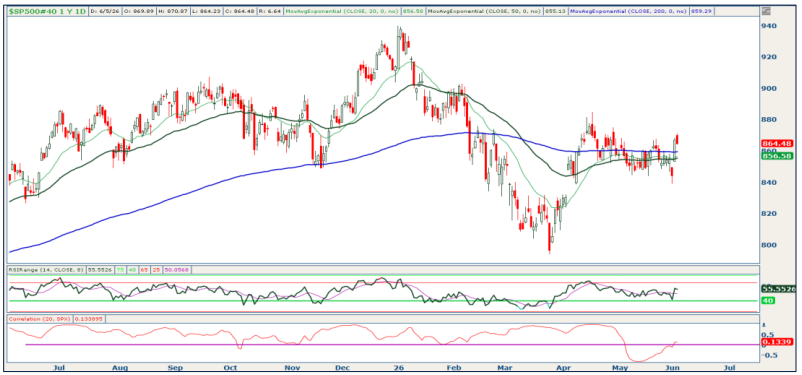
The S&P500 Financials sector shown below ($SP500#40) started the week lower but then rallied Thursday into Friday. The major indices did the opposite. The bottom subgraph shows a rolling 20 day correlation between the S&P500 and the financial sector, which until recently has all been positive. The divergence we’re seeing now is attributable to interest rates and future rate expectations. Higher rates are generally not helpful to equity prices because they increase borrowing costs, though those increased borrowing costs partially flow back to the financial sector in the form of wider lending spreads. If rates go too high, they can cause issues in credit quality. While we’ve seen hints of that with some funds restricting or limiting withdrawals, it’s been a minor issue thus far. Overall, the sector is healthy, bank stress is low and credit losses are still manageable. The index has been rangebound between $850 and $870 for the last two months. It’s pressing into the upper edge of that range again, and the RSI has held above the 40 line. Breaking above $870 is the next step to keep this bullish sentiment alive.
Source: Charles Schwab Corporation
IMPORTANT LEGAL NOTICE AND DISCLOSURE INFORMATION
Investment advisory service is provided by SVL Holding Corporation dba SVL Investments Management (“SVL”), a California registered investment advisor. Advisory services are subject to advisory fees as disclosed on Form ADV.
Investing involves risks, and investment decisions should be based on your own goals, time horizon, and tolerance for risk. The forecasts or forward-looking statements are based on assumptions, may not materialize, and are subject to revision without notice. International investments carry additional risks, which include differences in financial reporting standards, currency exchange rates, political risks unique to a specific country, foreign taxes and regulations, and the potential for illiquid markets.
Past performance may not be indicative of future results. Therefore, no current or prospective client should assume that future performance of any specific investment, investment strategy (including the investments and/or investment strategies recommended or undertaken by SVL) or product made reference to directly or indirectly by SVL in its web site, or indirectly via a link to an unaffiliated third party web site, will be profitable or equal the corresponding indicated performance level(s). Different types of investments involve varying degrees of risk, and there can be no assurance that the future performance of any specific investment, investment strategy, or product (including the investments and/or investment strategies recommended or undertaken by SVL), or any non-investment related content, made reference to directly or indirectly on this site will either be suitable or profitable for a client or prospective client’s investment portfolio. Historical performance results for investment indices and/or categories generally do not reflect the deduction of transaction and/or custodial charges, the deduction of an investment management fee, or the impact of taxes, the incurrence of which would have the effect of decreasing historical performance results for investment indices.
Certain portions of SVL‘s web site (i.e. blog, Insights, newsletters, articles, commentaries, etc.) may contain a discussion of, and/or provide access to, SVL‘s (and those of other investment and non-investment professionals) positions and/or recommendations as of a specific prior date. Due to various factors, including changing market conditions, such discussion may no longer be reflective of current position(s) and/or recommendation(s). Moreover, no client or prospective client should assume that any such discussion serves as the receipt of, or a substitute for, personalized advice from SVL or from any other investment professional. SVL is neither an attorney nor accountant, and no portion of the web site content should be interpreted as legal, accounting or tax advice.
Rankings and/or recognition by unaffiliated rating services and/or publications should not be construed by a client or prospective client as a guarantee that he/she will experience a certain level of results if SVL is engaged, or continues to be engaged, to provide investment advisory services, nor should it be construed as a current or past endorsement of SVL by any of its clients. Rankings published by magazines, and others, generally base their selections exclusively on information prepared and/or submitted by the recognized adviser.
To the extent that any client or prospective client utilizes any economic calculator or similar device contained within or linked to SVL‘s web site, the client and/or prospective client acknowledges and understands that the information resulting from the use of any such calculator/device, is not, and should not be construed, in any manner whatsoever, as the receipt of, or a substitute for, personalized individual advice from SVL, or from any other investment professional.
Each client and prospective client agrees, as a condition precedent to his/her/its access to SVL‘s web site, to release and hold harmless SVL, its officers, directors, owners, employees and agents from any and all adverse consequences resulting from any of his/her/its actions and/or omissions which are independent of his/her/its receipt of personalized individual advice from SVL.