

Weekly Newsletter June 29th to July 3rd
RECAPPING LAST WEEK
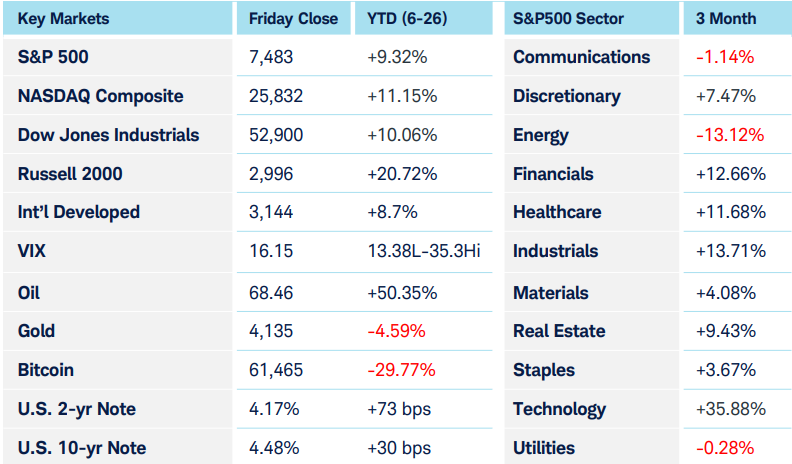
A lackluster showing for the labor market took center stage last week—June’s 57k new jobs number was nearly 50% below expectations, while the previous two months’ figures were revised down by a combined 74k. Meaning that 17k fewer jobs were created over the past quarter than had previously been estimated for April and May alone The unemployment rate ticked down .1% from the 4.3% figure that had persisted for the last several months; while layoffs remain limited, slowing job growth helped push the labor participation rate down to a 5-year low. Before those jobs numbers were released, the Fed Fund Futures had indicated a 40% chance of a rate hike at July’s meeting and 80% for September. Now, those figures have declined to 15% and 60%, respectively, effectively removing one of the expected hikes from 2026. Keep in mind, though, that Kevin Warsh only recently became Fed Chair, and questions remain about his process, so those numbers may be less predictive than they were previously. Warsh’s speech on Wednesday reinforced the 2% inflation target but removed the forward guidance that markets had come to expect from his predecessor, an absence that will take some getting used to. The reduced risk of a rate hike reversed the panic in U.S. Equity indices caused by last month’s report, and pulled the VIX down around 16, near its yearly low. Magnificent 7 stocks reclaimed their market leadership, gaining 6% as a group. Sector performance tilted towards risk as financials, communications, and discretionary sectors led, while risk-off sectors in staples and utilities lagged. Energy fell behind as oil prices slipped to nearly $67 per barrel. For most of the week, the dollar index held strong above $100, until Thursday when it dropped to that important inflection point. Treasury yields ended the week higher thanks to Warsh’s speech, while gold and silver held up at technical support levels. Cryptocurrencies finally caught a bid with Bitcoin, Ethereum, and Solana rising 3%, 7.5%, and 12% respectively. International stocks were mixed as developed markets rose and emerging markets lost ground.
THE WEEK AHEAD
Now that the employment report is behind us, this week’s focus will be on the health of the broader economy and how it might impact Fed policy. FOMC meeting minutes release Wednesday, providing further hints towards our new Chairman’s plans. Just as with Jerome Powell, Warsh’s predecessor, the press conference after the report could be more telling than the report itself and could yield clues about the chairman’s approach to balancing the Fed’s dual inflation/labor market mandate in the face of new data. Any increase in the unemployment claims report on Thursday could help confirm the weakening labor market sentiment indicated by last week’s jobs report. Market watchers expect Monday’s U.S. PMI numbers to show continued industry expansion, and existing home sales and consumer credit reports will arrive later in the week. Canada, where the unemployment rate sits at an elevated 6.6%, will get a jobs update on Friday, and further international inflation numbers from Germany, Japan, and China are scattered throughout the week. Lastly, the ECB’s monetary policy meeting minutes will hit Thursday.
CHART OF THE WEEK
The Flows of Currency
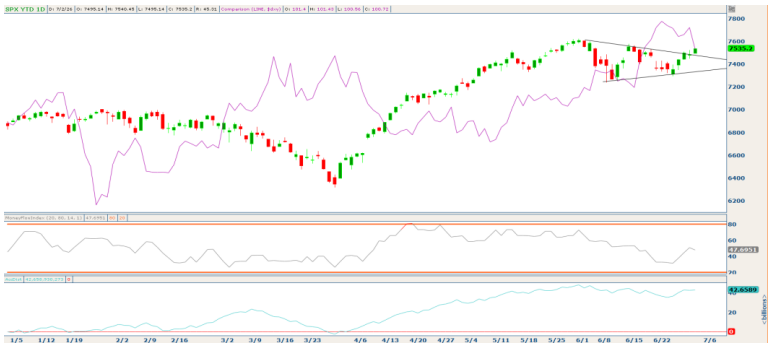
The U.S. dollar index ($DXY) relates the value of the U.S. dollar to six major global currencies: Euro (EUR), Japanese Yen (JPY), British Pound (GBP), Canadian Dollar (CAD), and Swedish Krona (SEK). When $DXY is rising, the U.S. dollar is strengthening against the basket of weighted currencies. Many influences factor into overall currency movements and trends. Macroeconomic conditions reflected through measures of the U.S. economy such as GDP (Gross Domestic Product), CPI (Consumer Price Index), the ISM Manufacturing Index, and employment metrics such as Non-Farm Payrolls often impact $DXY—and the overall stock market—upon release. Historically, there have been periods where the S&P 500 and the U.S. dollar have experienced a statistically significant inverse relationship. The chart below tracks SPX in candlesticks, and $DXY in the purple line year-to-date. The rapid strengthening of $DXY from late January through late March is contrasted with the weakening SPX over that time frame. Then, from early April through mid-May we see the opposite, where SPX’s advance was accompanied by $DXY’s decline. SPX then entered a consolidation phase, forming a symmetrical triangle price pattern from early June. A few volume metrics on SPX show it’s not “overbought” (where the Money Flow Index would be above the 80 level), but neither is it “oversold” (indicated by a reading below 20). Similarly, the Accumulation Distribution reflects low volumes of buying and selling. As of Thursday last week, a small bullish breakout on SPX alongside a drop in $DXY indicates a continuation of the prevailing bullish SPX uptrend.
Source: Charles Schwab Corporation
IMPORTANT LEGAL NOTICE AND DISCLOSURE INFORMATION
Investment advisory service is provided by SVL Holding Corporation dba SVL Investments Management (“SVL”), a California registered investment advisor. Advisory services are subject to advisory fees as disclosed on Form ADV.
Investing involves risks, and investment decisions should be based on your own goals, time horizon, and tolerance for risk. The forecasts or forward-looking statements are based on assumptions, may not materialize, and are subject to revision without notice. International investments carry additional risks, which include differences in financial reporting standards, currency exchange rates, political risks unique to a specific country, foreign taxes and regulations, and the potential for illiquid markets.
Past performance may not be indicative of future results. Therefore, no current or prospective client should assume that future performance of any specific investment, investment strategy (including the investments and/or investment strategies recommended or undertaken by SVL) or product made reference to directly or indirectly by SVL in its web site, or indirectly via a link to an unaffiliated third party web site, will be profitable or equal the corresponding indicated performance level(s). Different types of investments involve varying degrees of risk, and there can be no assurance that the future performance of any specific investment, investment strategy, or product (including the investments and/or investment strategies recommended or undertaken by SVL), or any non-investment related content, made reference to directly or indirectly on this site will either be suitable or profitable for a client or prospective client’s investment portfolio. Historical performance results for investment indices and/or categories generally do not reflect the deduction of transaction and/or custodial charges, the deduction of an investment management fee, or the impact of taxes, the incurrence of which would have the effect of decreasing historical performance results for investment indices.
Certain portions of SVL‘s web site (i.e. blog, Insights, newsletters, articles, commentaries, etc.) may contain a discussion of, and/or provide access to, SVL‘s (and those of other investment and non-investment professionals) positions and/or recommendations as of a specific prior date. Due to various factors, including changing market conditions, such discussion may no longer be reflective of current position(s) and/or recommendation(s). Moreover, no client or prospective client should assume that any such discussion serves as the receipt of, or a substitute for, personalized advice from SVL or from any other investment professional. SVL is neither an attorney nor accountant, and no portion of the web site content should be interpreted as legal, accounting or tax advice.
Rankings and/or recognition by unaffiliated rating services and/or publications should not be construed by a client or prospective client as a guarantee that he/she will experience a certain level of results if SVL is engaged, or continues to be engaged, to provide investment advisory services, nor should it be construed as a current or past endorsement of SVL by any of its clients. Rankings published by magazines, and others, generally base their selections exclusively on information prepared and/or submitted by the recognized adviser.
To the extent that any client or prospective client utilizes any economic calculator or similar device contained within or linked to SVL‘s web site, the client and/or prospective client acknowledges and understands that the information resulting from the use of any such calculator/device, is not, and should not be construed, in any manner whatsoever, as the receipt of, or a substitute for, personalized individual advice from SVL, or from any other investment professional.
Each client and prospective client agrees, as a condition precedent to his/her/its access to SVL‘s web site, to release and hold harmless SVL, its officers, directors, owners, employees and agents from any and all adverse consequences resulting from any of his/her/its actions and/or omissions which are independent of his/her/its receipt of personalized individual advice from SVL.