
Weekly Newsletter March 16th to March 20th
RECAPPING LAST WEEK
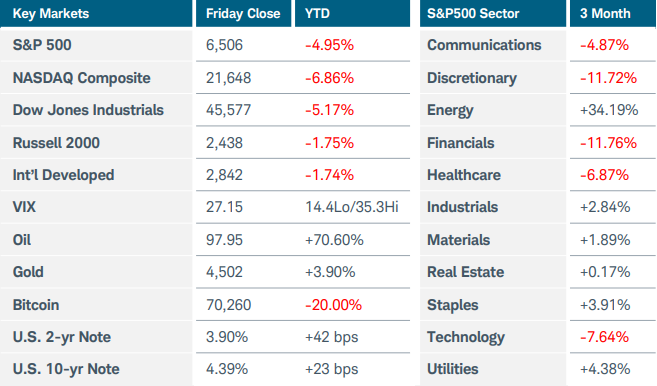
U.S. equity indices fell for a fourth straight week as the Iran war continued to roil energy markets and further clouded the outlook for inflation and interest rates. The spread between Brent crude— the global benchmark—and U.S.-based West Texas Intermediate crude widened to the largest gap in 11 years as the risk of Brent supply disruptions increased while releases from U.S. strategic reserves kept domestic prices relatively in check. WTI crude futures fell more than 1% to $97.95, while Brent futures jumped to over $119 before settling near $112, their highest level since the early months of Russia’s invasion of Ukraine. The Brent-WTI spread exceeded the high from that period. European natural gas prices surged nearly 30% after Iran attacked multiple energy facilities across the Middle East in response to Israel’s strike on its South Pars gas field. One piece of positive news emerged on Thursday when several European nations along with Japan expressed willingness to assist with safe passage for tankers through the Strait of Hormuz. The S&P500 and Nasdaq Composite indices fell 2% and the Russell 2000 lost 1.7%. Energy and financials were the only positive sectors last week, with the former now up more than 32% this year. U.S. Treasury yields continued to rise sharply, and precious metals tumbled after a hot inflation report and the Federal Reserve’s hawkish outlook. The Fed left rates unchanged while projecting higher inflation, steady employment, and only one rate cut for this year. Chair Powell said it was too soon to gauge the war’s effect on the economy but noted that the jump in oil prices has fueled rising inflation expectations in recent weeks. Turning to economic reports, U.S. producer prices rose more than expected last month at a pace of 0.7% MoM and 3.4% YoY. Manufacturing activity was little changed in New York state while continuing to expand in the Philadelphia region. Delayed data revealed that new home sales in January plummeted more than 17% MoM to the slowest pace since 2022. More supply and less demand forced builders to lower prices, with the median sales price falling nearly 7% YoY to $400,500. Overseas, Australia’s central bank raised rates for a second straight month in a tight 5-4 vote, citing material inflation risks. The Bank of Japan left rates unchanged but kept its options open for a rate hike in April. Central banks in Canada, Europe, and the UK also opted to keep rates steady, acknowledging the uncertain outlook for growth and inflation. Yields on British government gilts jumped to their highest level since 2008 as investors considered the possibility of rate hikes later this year. Traders are pricing in two or three rates hikes for Europe this year even as most economists still see no change. Finally, better-than-expected retail sales and industrial production figures gave China’s economy a kick start to begin the year.
THE WEEK AHEAD
The Middle East conflict extends into a fourth week and remains the focal point for investors. Oil prices will continue to drive sentiment. While a resolution could appear at any time, the potential for negative impacts on the global economy grows the longer the conflict continues. The first batch of economic reports that could reflect the effects of rising energy prices will be the global flash PMI surveys on Tuesday. The reports will be scrutinized for signs of higher prices and any supply chain issues. In the U.S., the rest of the economic calendar is sparse, with Friday’s revised consumer sentiment and inflation expectations likely to garner the most interest. Last week’ spike in the 10-year Treasury yield to nearly 4.4% has sounded some alarm bells, and the U.S. dollar could resume its upward trend in the wake of the FOMC meeting. At the December meeting, six of 19 Fed officials were projecting no rate cuts for 2026—that number has now increased to seven. On the international side, consumer inflation updates from Japan, Australia, and the UK are on the docket. While these will not yet incorporate data from this month, they should provide a better picture of inflation trends leading up to the Middle East conflict.
CHART OF THE WEEK
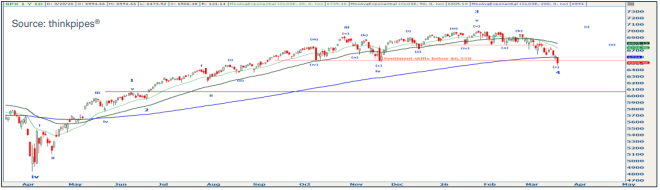
Inflection point for equities
Going into last week, the S&P500 index (SPX) had been essentially flat over the past six months. It first reached $6,550 in September and ultimately ascended to just above $7,000. However, three major pullbacks along the way—in October, November, and this month—brought the index back to around $6,550, marking that area as an important technical support. Applying an Elliott Wave analysis from last April’s low also highlights why that level is important. Currently it appears that SPX may be in the last stage of wave 4, a corrective wave. Interestingly, the April low was a 4th wave of one larger degree, while the November low was a 4th wave of one lesser degree. In each of these cases, it’s important to note the pattern leading into those corrections. Wave 3, an impulse wave moving in the direction of the overall upward trend, pushes higher, eventually losing momentum and dropping in wave 4 before finding support and rallying into wave 5. The most common retracement level for wave 4 to arrive at is the wave 4 of one lesser degree, which in this case was the November low at $6,550. One lesser degree from that was the October low, also at $6,550. If this level holds it would represent a near-textbook corrective sequence, potentially setting wave 5 up to reach new highs. However, SPX closed below support and the 200-day exponential moving average on Friday, and if this critical backstop fails the prospects of a larger drop down to the $6,060 area increase significantly.
Source: Charles Schwab Corporation
IMPORTANT LEGAL NOTICE AND DISCLOSURE INFORMATION
Investment advisory service is provided by SVL Holding Corporation dba SVL Investments Management (“SVL”), a California registered investment advisor. Advisory services are subject to advisory fees as disclosed on Form ADV.
Investing involves risks, and investment decisions should be based on your own goals, time horizon, and tolerance for risk. The forecasts or forward-looking statements are based on assumptions, may not materialize, and are subject to revision without notice. International investments carry additional risks, which include differences in financial reporting standards, currency exchange rates, political risks unique to a specific country, foreign taxes and regulations, and the potential for illiquid markets.
Past performance may not be indicative of future results. Therefore, no current or prospective client should assume that future performance of any specific investment, investment strategy (including the investments and/or investment strategies recommended or undertaken by SVL) or product made reference to directly or indirectly by SVL in its web site, or indirectly via a link to an unaffiliated third party web site, will be profitable or equal the corresponding indicated performance level(s). Different types of investments involve varying degrees of risk, and there can be no assurance that the future performance of any specific investment, investment strategy, or product (including the investments and/or investment strategies recommended or undertaken by SVL), or any non-investment related content, made reference to directly or indirectly on this site will either be suitable or profitable for a client or prospective client’s investment portfolio. Historical performance results for investment indices and/or categories generally do not reflect the deduction of transaction and/or custodial charges, the deduction of an investment management fee, or the impact of taxes, the incurrence of which would have the effect of decreasing historical performance results for investment indices.
Certain portions of SVL‘s web site (i.e. blog, Insights, newsletters, articles, commentaries, etc.) may contain a discussion of, and/or provide access to, SVL‘s (and those of other investment and non-investment professionals) positions and/or recommendations as of a specific prior date. Due to various factors, including changing market conditions, such discussion may no longer be reflective of current position(s) and/or recommendation(s). Moreover, no client or prospective client should assume that any such discussion serves as the receipt of, or a substitute for, personalized advice from SVL or from any other investment professional. SVL is neither an attorney nor accountant, and no portion of the web site content should be interpreted as legal, accounting or tax advice.
Rankings and/or recognition by unaffiliated rating services and/or publications should not be construed by a client or prospective client as a guarantee that he/she will experience a certain level of results if SVL is engaged, or continues to be engaged, to provide investment advisory services, nor should it be construed as a current or past endorsement of SVL by any of its clients. Rankings published by magazines, and others, generally base their selections exclusively on information prepared and/or submitted by the recognized adviser.
To the extent that any client or prospective client utilizes any economic calculator or similar device contained within or linked to SVL‘s web site, the client and/or prospective client acknowledges and understands that the information resulting from the use of any such calculator/device, is not, and should not be construed, in any manner whatsoever, as the receipt of, or a substitute for, personalized individual advice from SVL, or from any other investment professional.
Each client and prospective client agrees, as a condition precedent to his/her/its access to SVL‘s web site, to release and hold harmless SVL, its officers, directors, owners, employees and agents from any and all adverse consequences resulting from any of his/her/its actions and/or omissions which are independent of his/her/its receipt of personalized individual advice from SVL.