
Weekly Newsletter March 23rd to March 27th
RECAPPING LAST WEEK
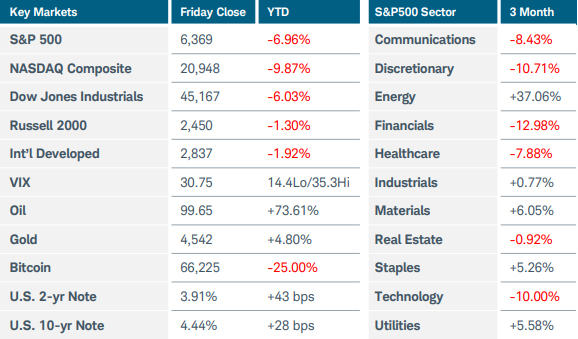
U.S. equity indices sold off sharply at week’s end amid little tangible progress toward ending the war in Iran. The Nasdaq Composite index lost more than 3% while the S&P500 slid 2%. The Russell 2000 fared better, rising marginally. Oil prices continued to drive the narrative: after plunging Monday on hopes for negotiations and de-escalation in the Middle East, crude and Brent futures steadily clawed back losses to finish higher for the week. U.S. sector performance was mixed, with sharp gains in energy (+5%) and basic materials (+4%) offset by weakness in technology (-4%) and communications (-4.5%). The latter were dragged down after Meta and Alphabet were found liable for social media addiction in two separate trials. Rising energy costs pushed the inflation narrative, sending U.S. Treasury yields to eight-month highs. The 10-year note yield jumped as high as 4.48%, up nearly 50 basis points in this month alone. Relatively poor demand at a trio of short- to intermediate-term Treasury auctions also pressured bond prices and contributed to the rise in yields. U.S. mortgage rates rose for a third straight week, with the 30- year contract lifting to 6.43%. Despite President Trump extending the deadline for Iran to reopen the Strait of Hormuz to April 6 and unconfirmed reports of talks between the countries, investors were skeptical and the Cboe Volatility index (VIX) spiked back above 30. Federal Reserve officials expressed growing concern over the economic outlook and inflation impacts. Turning to economic data, the costs of war started to become evident in this month’s S&P Global Flash PMI surveys. U.S. business activity stayed in expansion territory but slowed to an 11-month low, while prices paid for inputs and output prices charged to consumers both rose. U.S. import prices increased 0.5% MoM in February, the largest jump in nearly four years. The final reading of consumer sentiment for March dropped to 53.3 and one-year inflation expectations rose to 3.8% from 3.4% in the initial estimate. Overseas, private sector growth in the UK and Eurozone stalled this month as manufacturers’ input costs surged, leading them to raise prices at the fastest pace in nearly a year. ECB President Lagarde warned that the central bank could respond “forcefully” should inflation appear likely to persist above the 2% target for an extended period. The Bank of Japan released a new measure of its core consumer price index that showed a 2.2% YoY rise in February. Minutes from the central bank’s January meeting revealed a hawkish bias even before the Iran war jolted oil prices. Finally, China started multiple investigations into U.S. trade practices in response to similar inquiries initiated by the U.S. earlier this month.
THE WEEK AHEAD
A rough first quarter draws to a close this week, with the S&P500 down about 7% thus far. Disruptions from artificial intelligence and concerns about the private credit markets, on top of the Iran conflict, have rattled investors after three straight years of solid gains. March’s non-farm payrolls will be released on Good Friday even as U.S. markets are closed for the holiday. Expectations are for a rebound of 50,000 jobs created after the prior month’s shocking decline of 92,000. Even if the labor market deteriorates further, surging energy prices have shifted the Fed’s focus from employment towards re-emerging inflation pressures. Fed funds futures are no longer pricing in any rate cuts this year and suggest a modest chance of a hike. The JOLTS job openings, Challenger job cuts, and ADP private payrolls reports will be released earlier in the week. Other data points on the domestic calendar include ISM manufacturing PMI, retail sales, and consumer confidence. On the international side, central banks in Europe and the UK may be forced to raise rates several times this year to fight energy price shocks, given that they are highly dependent on oil and gas exports from the Middle East. Germany and the wider Eurozone will release February’s pre-war inflation data early in the week. Japan, another country very reliant on Middle Eastern energy products, reports preliminary March CPI figures from the Tokyo district on Monday evening.
CHART OF THE WEEK
Volatility curve inverts
The Cboe Volatility index (VIX), often referred to as the equity market’s fear or uncertainty gauge, tracks implied volatility on the S&P500 index (SPX) looking out 30 days. There are other volatility indices that track time frames further in the future—three months for example (VIX3M). Typically, the level of VIX3M would be higher than VIX because there is more uncertainty further into the future, but in stressful times the relationship sometimes inverts, as we are seeing now. Since war in Iran began, VIX has spiked above VIX3M multiple times, indicated by the ratio study falling below one in the chart’s lower pane. This typically reflects an influx of near-term hedging demand, not necessarily repricing of prolonged uncertainty. The last three times this occurred—in April, October, and November 2025—and comparing it to the SPX price (purple line in top pane), you can see that this inversion marked an intermediate-term low for equities. Sometimes, though, the inversion can deepen before it reverses, as it did in April when the fear and uncertainty was much stronger than the other instances. With SPX breaking technical support this week, VIX may move to new highs and increase its gap above VIX3M until investors eventually capitulate, forming a bottom from which equity prices could potentially reverse trend.
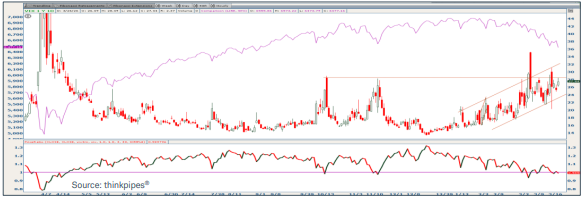
Source: Charles Schwab Corporation
IMPORTANT LEGAL NOTICE AND DISCLOSURE INFORMATION
Investment advisory service is provided by SVL Holding Corporation dba SVL Investments Management (“SVL”), a California registered investment advisor. Advisory services are subject to advisory fees as disclosed on Form ADV.
Investing involves risks, and investment decisions should be based on your own goals, time horizon, and tolerance for risk. The forecasts or forward-looking statements are based on assumptions, may not materialize, and are subject to revision without notice. International investments carry additional risks, which include differences in financial reporting standards, currency exchange rates, political risks unique to a specific country, foreign taxes and regulations, and the potential for illiquid markets.
Past performance may not be indicative of future results. Therefore, no current or prospective client should assume that future performance of any specific investment, investment strategy (including the investments and/or investment strategies recommended or undertaken by SVL) or product made reference to directly or indirectly by SVL in its web site, or indirectly via a link to an unaffiliated third party web site, will be profitable or equal the corresponding indicated performance level(s). Different types of investments involve varying degrees of risk, and there can be no assurance that the future performance of any specific investment, investment strategy, or product (including the investments and/or investment strategies recommended or undertaken by SVL), or any non-investment related content, made reference to directly or indirectly on this site will either be suitable or profitable for a client or prospective client’s investment portfolio. Historical performance results for investment indices and/or categories generally do not reflect the deduction of transaction and/or custodial charges, the deduction of an investment management fee, or the impact of taxes, the incurrence of which would have the effect of decreasing historical performance results for investment indices.
Certain portions of SVL‘s web site (i.e. blog, Insights, newsletters, articles, commentaries, etc.) may contain a discussion of, and/or provide access to, SVL‘s (and those of other investment and non-investment professionals) positions and/or recommendations as of a specific prior date. Due to various factors, including changing market conditions, such discussion may no longer be reflective of current position(s) and/or recommendation(s). Moreover, no client or prospective client should assume that any such discussion serves as the receipt of, or a substitute for, personalized advice from SVL or from any other investment professional. SVL is neither an attorney nor accountant, and no portion of the web site content should be interpreted as legal, accounting or tax advice.
Rankings and/or recognition by unaffiliated rating services and/or publications should not be construed by a client or prospective client as a guarantee that he/she will experience a certain level of results if SVL is engaged, or continues to be engaged, to provide investment advisory services, nor should it be construed as a current or past endorsement of SVL by any of its clients. Rankings published by magazines, and others, generally base their selections exclusively on information prepared and/or submitted by the recognized adviser.
To the extent that any client or prospective client utilizes any economic calculator or similar device contained within or linked to SVL‘s web site, the client and/or prospective client acknowledges and understands that the information resulting from the use of any such calculator/device, is not, and should not be construed, in any manner whatsoever, as the receipt of, or a substitute for, personalized individual advice from SVL, or from any other investment professional.
Each client and prospective client agrees, as a condition precedent to his/her/its access to SVL‘s web site, to release and hold harmless SVL, its officers, directors, owners, employees and agents from any and all adverse consequences resulting from any of his/her/its actions and/or omissions which are independent of his/her/its receipt of personalized individual advice from SVL.