
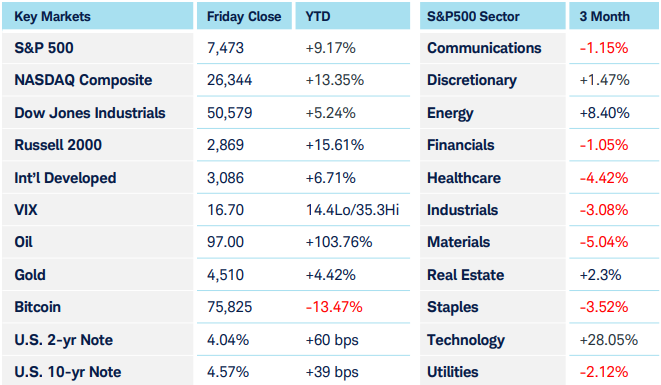
Weekly Newsletter May 18th to May 22nd
RECAPPING LAST WEEK
After dipping early in the week, pressured by rising yields and the imminent possibility of renewed military conflict with Iran, US equity indices reversed course by midweek and ended up either just beneath (S&P 500), at (Nasdaq 100), or above all time highs (DJIA.) Nvidia, the bluest of the bluechip chipmakers, announced earnings and revenues that once again beat street estimates, yet the stock and broader market barely responded. Increased spending by U.S. hyperscalers more than made up for CEO Jensen Huang conceding the Chinese AI chip market, their market share having fallen from 90% to zero. Thursday the U.S announced that it would be investing $2B in quantum computing-related stocks. A billion of that is going to IBM, which is up over 15% since the announcement, and the smaller pure-play quantum stocks that will be receiving the remaining funds (Global Foundries-GFS, D-Wave Quantum-QBTS, Rigetti Computing-RGTI, and InfleqtionINFQ) rallied as much as 50% on the news. S&P500 sector performance reflected a broadening but defensive-leaning rally, with utilities and health care seeing the largest gains for the week, followed by real estate, while technology remained supported by AI and semiconductors. U.S. Treasuries were the key macro pressure point, with 10-year Treasury yields reaching their highest levels since January 2025 and the 30-year touching their highest level since 2007. Inflation worries, energy-price risk, and a less-dovish Fed path weighed on duration, yet by end of week, yields had returned to last week’s closing levels. Fed funds futures now indicate a mere 32% probability of rates remaining where they are at year end, a 42% probability of a quarter point hike, with chances for rates being 50 or 75 basis points higher comprising the remaining possibilities. After moving decisively higher against most major currencies the prior week, the U.S. dollar consolidated in a fairly tight range. Even a report showing Japanese core inflation running at 4-year lows wasn’t sufficient to push USD/JPY out of the 159 range where it meandered all week. Crude oil spent the week gyrating around $100 before peaking north of $105 ahead of President Trump calling off a planned Tuesday attack against Iran, citing his optimism over ongoing “serious negotiations.” The July contract settled near two-week lows at $96.60. Precious metal and crypto markets rounded out the theme of a quiet pre-holiday week whereby in the absence of catalysts, consolidation ruled the week.
THE WEEK AHEAD
The last week of May sees a holiday shortened week, with not only U.S. markets closed Monday for Memorial Day but UK markets (Spring Bank Holiday) and continental European markets (Whit Monday) as well. Attention will likely shift from earnings momentum to macroeconomic validation, with markets watching the equity rally for challenges posed by elevated yields and oil-linked inflation. The global economic calendar remains pretty light, with inflation related economic releases attracting the most attention. Australian CPI is released Tuesday, with expectations of a hot year-over-year reading of 4.4%. Thursday sees the release of the U.S. Personal Consumption Expenditures index-any mention of which one is seemingly obligated to state “the Fed’s preferred inflation gauge.” A distinct way in which the PCE differs from CPI is that it accounts for consumer substitution of goods rather than using a fixed basket of goods. Hence, when inflation is rising, as is now, driven by energy prices, consumers adjusting their spending by “trading down” in other areas is something that PCE can capture that CPI does not. So, expectations are for the core PCE numbers to come in at a relatively benign 0.3% month over month and 3.5% year over year. New home sales, which arrive Thursday, will provide a key rate-sensitivity check for the sector. A handful of tech companies report on Wednesday; Marvell Technologies (MRVL), Salesforce (CRM), Snowflake (SNOW), Synopsis (SNPS), and HP (HPQ), with Dell (DELL) rounding out earnings season on Thursday along with retail giant Costco (COST.)
CHART OF THE WEEK
Healthcare’s diagnosis becoming more conclusive
As of last Friday, Healthcare was the only of the 11 broad-based S&P 500 sectors with negative trailing 6-month performance (-3.7%). Despite being a stalwart for employment and job growth across sectors, notable headwinds exist. Persistent policy uncertainties, elevated healthcare costs, and the momentum across competing sectors such as Information Technology and Energy help explain the relative underperformance. Conversely, AI and GLP-1 tailwinds have favored the pharmaceutical and biotech sub-industries. The 2-year chart below suggests emerging technical strength in the healthcare sector ($SP500#35). The moving average convergence/divergence indicator better known as the MACD highlights two bullish divergences, one from April/May of last year, which kicked off a strong bull run, and another like it that showed up last month. Higher lows on the MACD indicator coinciding with lower lows in price signal a potential reversal of the recent down-trend. When these happen at already established technical support it adds confidence to the signal. The RSI indicator’s climb and price breaking through both the 50 and 200-day moving averages are additional positives, although it’s now bumping up to technical resistance shown by the upper horizontal black line. The positive chart setup is already there for healthcare stocks but clearing that resistance is the next step towards all time highs.
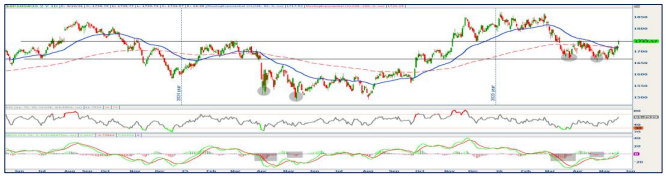
Source: Charles Schwab Corporation
IMPORTANT LEGAL NOTICE AND DISCLOSURE INFORMATION
Investment advisory service is provided by SVL Holding Corporation dba SVL Investments Management (“SVL”), a California registered investment advisor. Advisory services are subject to advisory fees as disclosed on Form ADV.
Investing involves risks, and investment decisions should be based on your own goals, time horizon, and tolerance for risk. The forecasts or forward-looking statements are based on assumptions, may not materialize, and are subject to revision without notice. International investments carry additional risks, which include differences in financial reporting standards, currency exchange rates, political risks unique to a specific country, foreign taxes and regulations, and the potential for illiquid markets.
Past performance may not be indicative of future results. Therefore, no current or prospective client should assume that future performance of any specific investment, investment strategy (including the investments and/or investment strategies recommended or undertaken by SVL) or product made reference to directly or indirectly by SVL in its web site, or indirectly via a link to an unaffiliated third party web site, will be profitable or equal the corresponding indicated performance level(s). Different types of investments involve varying degrees of risk, and there can be no assurance that the future performance of any specific investment, investment strategy, or product (including the investments and/or investment strategies recommended or undertaken by SVL), or any non-investment related content, made reference to directly or indirectly on this site will either be suitable or profitable for a client or prospective client’s investment portfolio. Historical performance results for investment indices and/or categories generally do not reflect the deduction of transaction and/or custodial charges, the deduction of an investment management fee, or the impact of taxes, the incurrence of which would have the effect of decreasing historical performance results for investment indices.
Certain portions of SVL‘s web site (i.e. blog, Insights, newsletters, articles, commentaries, etc.) may contain a discussion of, and/or provide access to, SVL‘s (and those of other investment and non-investment professionals) positions and/or recommendations as of a specific prior date. Due to various factors, including changing market conditions, such discussion may no longer be reflective of current position(s) and/or recommendation(s). Moreover, no client or prospective client should assume that any such discussion serves as the receipt of, or a substitute for, personalized advice from SVL or from any other investment professional. SVL is neither an attorney nor accountant, and no portion of the web site content should be interpreted as legal, accounting or tax advice.
Rankings and/or recognition by unaffiliated rating services and/or publications should not be construed by a client or prospective client as a guarantee that he/she will experience a certain level of results if SVL is engaged, or continues to be engaged, to provide investment advisory services, nor should it be construed as a current or past endorsement of SVL by any of its clients. Rankings published by magazines, and others, generally base their selections exclusively on information prepared and/or submitted by the recognized adviser.
To the extent that any client or prospective client utilizes any economic calculator or similar device contained within or linked to SVL‘s web site, the client and/or prospective client acknowledges and understands that the information resulting from the use of any such calculator/device, is not, and should not be construed, in any manner whatsoever, as the receipt of, or a substitute for, personalized individual advice from SVL, or from any other investment professional.
Each client and prospective client agrees, as a condition precedent to his/her/its access to SVL‘s web site, to release and hold harmless SVL, its officers, directors, owners, employees and agents from any and all adverse consequences resulting from any of his/her/its actions and/or omissions which are independent of his/her/its receipt of personalized individual advice from SVL.