
Weekly Newsletter May 25th to May 29th
RECAPPING LAST WEEK
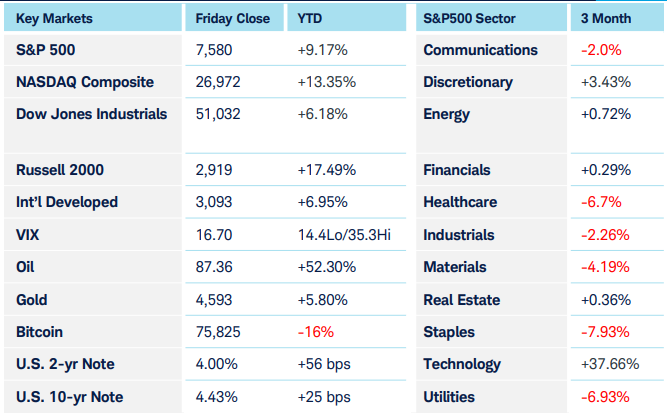
U.S. equities extended their rally for a ninth consecutive week, with the S&P 500 climbing as easing oil prices, resilient earnings, and AI-linked momentum overcame inflation concerns. Alongside the S&P, the Nasdaq-100, Nasdaq Composite, and DJIA all closed at record highs on Friday, with only the Russell 2000 pulling back a touch from Thursday’s record close. Dell’s (DELL) earnings blowout announcement was just the latest example in a growing list of companies benefiting by massive AI infrastructure spending in a week that also saw Micron (MU) join the trillion-dollar market cap club. S&P 500 sector performance favored growth and technology, while consumer discretionary responded well to the lessening of inflation expectations amid a sharp drop in energy prices which in turn lessened the likelihood of rate hikes. Of course, the flip side of the sector performance coin was energy as the worst performer followed by consumer staples. U.S. Treasury yields eased throughout the week, improving risk sentiment, though the broader rate backdrop remains fragile. The 10- year settled below 4.5% and the 30-year under 5%, while the 2-year note, more sensitive to short-term rate expectations, remained above 4%. Overall, foreign currency markets were quiet amid the minor shifting of interest rate expectations. For the Yen, this quietness masked a great deal of activity beneath the surface: over the past month the Japanese Ministry of Finance intervened in the currency markets for the first time since 2024 selling over $73 billion USD/JPY to support the Yen. As a mercantilist, export-driven economy, Japan would normally welcome a weaker currency, but in this case concerns about the nation’s dependence on dollar-denominated imported energy seems to have been the overriding concern. In spite of ongoing small-scale military skirmishes, progress on the U.S./Iran diplomatic front led to a nearly $10 per barrel decline in the price of oil. U.S. priorities seem to be getting the Strait of Hormuz open even while Iran, through its public statements, isn’t backing down from what they claim is their right to enrich uranium. For now, the market seems focused on the prospect for oil to be able to make it’s way out of the Persian Gulf again. Precious metals were quiet, apparently neither a risk-on nor risk-off proxy this week, while over the past two weeks, the insatiable demand for tech stocks has led to a negative correlation of crypto with equities.
THE WEEK AHEAD
The June 5 U.S. non-farm payrolls report is the week’s marquee event, with markets eager to learn whether labor will put up strong numbers, meaning the Fed will be likely to leave rates higher for longer, or will show signs of cooling, which could ease Treasury yield pressure. Macro investors will also be watching developments in U.S.-Iranian negotiations—If the market sees continued momentum toward a solution that reopens the Strait of Hormuz, lower energy prices and inflation expectations could be on the horizon. This would extend the virtuous circle whereby these trends reduce the chance of rate hikes, which in turn could support the ongoing sharp rally in equity markets. Of course, if talks fail and and the U.S. revives its active military campaign, equity markets could very well be facing the same headwinds of higher inflation expectations due to a sustained increase in energy prices which they’ve previously pushed through. ISM manufacturing and services data will help clarify the growth/inflation mix, clarifying whether companies’ efforts to pass higher input costs through to consumers are resulting in softening demand. If energy prices remain under pressure, the market’s focus on inflation numbers will likely shift toward growth and employment data, the latter of which we’ll see plenty of this week. In addition to Friday’s report, Tuesday sees the JOLTS job openings number, Wednesday brings data from the private payroll company ADP, and the weekly jobless claims numbers arrive on Thursday
CHART OF THE WEEK
A Matter of Size
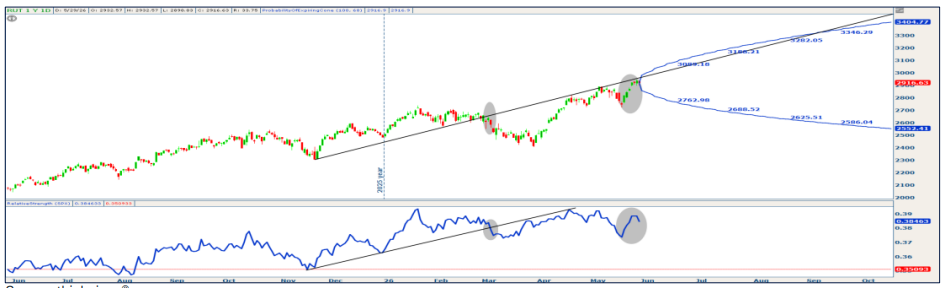
The Russell 2000 Index (RUT) tracks the performance of the US equity market’s small cap segment. Its market capitalization weights toward the industrials, healthcare, and financials sectors. Last week’s positive momentum in RUT was underpinned by a slight weakening in the U.S. Dollar alongside a more pronounced drop in Treasury yields. That “one, two punch” historically tends to favor small caps more directly than large caps. The Russell 2000 chart presents the Relative Strength (RS) indicator in the lowest pane gauged against S&P 500 (SPX) performance. When rising, it exhibits a stronger performance in RUT relative to SPX. Trend lines are commonly drawn to delineate possible continued strength when the RS line is generally trending up as was the case identified from November ’25 through late February ’26. In early March, the trendline support was broken on the sharper RUT pullback, reflecting short-lived relative weakness against SPX. Last week’s surge in the RUT brings it to a key technical overhead resistance level. The added Probability of Expiring Cone technical study can be used as a forecasting tool capturing a one standard deviation move in the underlying (RUT) into future time frames, which can be customized. In this case, an interpretation is that 68% of the time, based on past historical volatility of RUT, index levels “should” fall inside the cone. Even a minor potential bullish break of resistance would position RUT very near to the upper expected level of near-term statistical probability.
Source: Charles Schwab Corporation
IMPORTANT LEGAL NOTICE AND DISCLOSURE INFORMATION
Investment advisory service is provided by SVL Holding Corporation dba SVL Investments Management (“SVL”), a California registered investment advisor. Advisory services are subject to advisory fees as disclosed on Form ADV.
Investing involves risks, and investment decisions should be based on your own goals, time horizon, and tolerance for risk. The forecasts or forward-looking statements are based on assumptions, may not materialize, and are subject to revision without notice. International investments carry additional risks, which include differences in financial reporting standards, currency exchange rates, political risks unique to a specific country, foreign taxes and regulations, and the potential for illiquid markets.
Past performance may not be indicative of future results. Therefore, no current or prospective client should assume that future performance of any specific investment, investment strategy (including the investments and/or investment strategies recommended or undertaken by SVL) or product made reference to directly or indirectly by SVL in its web site, or indirectly via a link to an unaffiliated third party web site, will be profitable or equal the corresponding indicated performance level(s). Different types of investments involve varying degrees of risk, and there can be no assurance that the future performance of any specific investment, investment strategy, or product (including the investments and/or investment strategies recommended or undertaken by SVL), or any non-investment related content, made reference to directly or indirectly on this site will either be suitable or profitable for a client or prospective client’s investment portfolio. Historical performance results for investment indices and/or categories generally do not reflect the deduction of transaction and/or custodial charges, the deduction of an investment management fee, or the impact of taxes, the incurrence of which would have the effect of decreasing historical performance results for investment indices.
Certain portions of SVL‘s web site (i.e. blog, Insights, newsletters, articles, commentaries, etc.) may contain a discussion of, and/or provide access to, SVL‘s (and those of other investment and non-investment professionals) positions and/or recommendations as of a specific prior date. Due to various factors, including changing market conditions, such discussion may no longer be reflective of current position(s) and/or recommendation(s). Moreover, no client or prospective client should assume that any such discussion serves as the receipt of, or a substitute for, personalized advice from SVL or from any other investment professional. SVL is neither an attorney nor accountant, and no portion of the web site content should be interpreted as legal, accounting or tax advice.
Rankings and/or recognition by unaffiliated rating services and/or publications should not be construed by a client or prospective client as a guarantee that he/she will experience a certain level of results if SVL is engaged, or continues to be engaged, to provide investment advisory services, nor should it be construed as a current or past endorsement of SVL by any of its clients. Rankings published by magazines, and others, generally base their selections exclusively on information prepared and/or submitted by the recognized adviser.
To the extent that any client or prospective client utilizes any economic calculator or similar device contained within or linked to SVL‘s web site, the client and/or prospective client acknowledges and understands that the information resulting from the use of any such calculator/device, is not, and should not be construed, in any manner whatsoever, as the receipt of, or a substitute for, personalized individual advice from SVL, or from any other investment professional.
Each client and prospective client agrees, as a condition precedent to his/her/its access to SVL‘s web site, to release and hold harmless SVL, its officers, directors, owners, employees and agents from any and all adverse consequences resulting from any of his/her/its actions and/or omissions which are independent of his/her/its receipt of personalized individual advice from SVL.