
Weekly Newsletter May 4th to May 8th
RECAPPING LAST WEEK
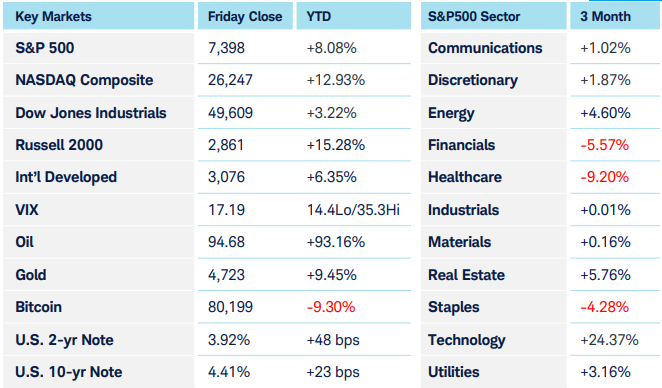
U.S. equities stayed firmly risk-on, driving to new record highs last week with semiconductors—and more broadly the NASDAQ-100—rising by 11% and 5% respectively. Geopolitical risks associated with U.S.– Iran tensions eased, driving oil prices down from $107/barrel at the start of the week to $95 at week’s end. Sector leadership was heavily growth-oriented, with technology the standout performer. Seven of eleven S&P500 sectors gained ground, and AI and semiconductor momentum remained the key market drivers. Metals shot higher, with gold up 2.5% and silver up nearly 7%, but copper was the leader, rising 8.75%. Friday’s April jobs report reinforced the “resilient growth” narrative—nonfarm payrolls rose 115,000 against expectations closer to 55,000-65,000, while the unemployment rate held steady. On the consumer front, the University of Michigan index fell to 48.2, reflecting pressure from gasoline prices and inflation concerns. Soft-data like surveys and expectations may be one factor, but the hard-data, real numbers, held firm. ISM Services PMI rose to 53.6, and new home sales rose 7.4% as supply tightened and mortgage rates offered a little relief. Construction spending rose as well led by office and data centers. The skyrocketing capital expenditures have to go somewhere. Consumer credit doubled its forecast to $24.9 billion. Back to the labor market, unemployment claims were 200K (just under forecast) and continuing claims hit a two-year low. None of that seems significant enough to impact the Fed’s “higher for longer” mentality. European data came in much weaker than the U.S. as supply disruptions and the corresponding inflation hit them harder. German manufacturing still expanded, but services activity sunk along with industrial production, pulling overall business activity down at speeds not seen in nearly 4 years. The broader Eurozone was similar, with expanding manufacturing and weaker services inching composite PMIs dangerously close to stagnation territory. Canadian labor markets continued to be pressured by widespread inflationary pressures, and the Reserve Bank of Australia struck a hawkish tone and raised rates 4.35%.
THE WEEK AHEAD
April CPI will be the main U.S. macro event this week. At a macro level, though, investors continue to debate which is more resilient: global growth and solid corporate earnings on the one hand, or persistent inflation pressures tied to elevated energy prices, geopolitical risk, and a still-cautious central bank backdrop on the other. PPI follows Wednesday, providing an additional read on wholesale inflation and corporate cost pressures, particularly for sectors exposed to commodities, transportation, and imported inputs. Retail sales and consumer spending will shed light on the degree to which higher gasoline prices are affecting consumers. Overseas, investors will be watching industrial production, inflation (of course) and confidence data out of Germany enlightening the potential path to stagnation. Internationally, China’s inflation data and central bank commentary will matter, as markets assess whether weak global demand, higher commodity costs, and cautious central banks are becoming a more synchronized theme.
CHART OF THE WEEK
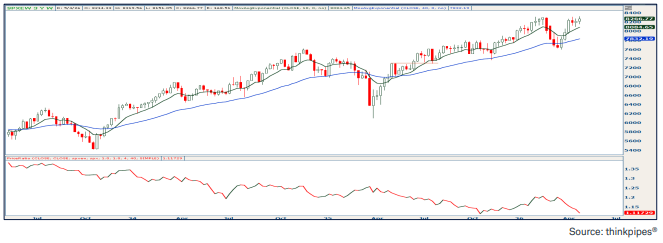
Equal Weights lag, but still march higher
We are in an equity bull market. That’s just a fact as indexes push further into uncharted territory. The conversation on when it ends is valid, but entirely different. One of the most common causes of doubt are constant headlines of an AI bubble due to mega cap outperformance vs smaller cap stocks. When companies that large outperform, a cap weighted index tells you very little about the health of the broader market, and therefore can be dangerous by causing blind spots. So check your blind spot. This chart shows the equal weight S&P500 (SPXEW) on top and the ratio vs the cap weighted version below. The ratio is clearly down-trending and that often can precede a downturn in the broad market by covering up other signs of weakness you might see clearly otherwise. Yet that alone is not indicating weakness, and as the top chart shows its still trending up and to the right. If those other areas are still healthy, they aren’t hurt by a different sector being “more healthy.” Diverging directions between these two is a signal, but you need to understand why, and in this case, at least so far, outperformance is just added strength.
Source: Charles Schwab Corporation
IMPORTANT LEGAL NOTICE AND DISCLOSURE INFORMATION
Investment advisory service is provided by SVL Holding Corporation dba SVL Investments Management (“SVL”), a California registered investment advisor. Advisory services are subject to advisory fees as disclosed on Form ADV.
Investing involves risks, and investment decisions should be based on your own goals, time horizon, and tolerance for risk. The forecasts or forward-looking statements are based on assumptions, may not materialize, and are subject to revision without notice. International investments carry additional risks, which include differences in financial reporting standards, currency exchange rates, political risks unique to a specific country, foreign taxes and regulations, and the potential for illiquid markets.
Past performance may not be indicative of future results. Therefore, no current or prospective client should assume that future performance of any specific investment, investment strategy (including the investments and/or investment strategies recommended or undertaken by SVL) or product made reference to directly or indirectly by SVL in its web site, or indirectly via a link to an unaffiliated third party web site, will be profitable or equal the corresponding indicated performance level(s). Different types of investments involve varying degrees of risk, and there can be no assurance that the future performance of any specific investment, investment strategy, or product (including the investments and/or investment strategies recommended or undertaken by SVL), or any non-investment related content, made reference to directly or indirectly on this site will either be suitable or profitable for a client or prospective client’s investment portfolio. Historical performance results for investment indices and/or categories generally do not reflect the deduction of transaction and/or custodial charges, the deduction of an investment management fee, or the impact of taxes, the incurrence of which would have the effect of decreasing historical performance results for investment indices.
Certain portions of SVL‘s web site (i.e. blog, Insights, newsletters, articles, commentaries, etc.) may contain a discussion of, and/or provide access to, SVL‘s (and those of other investment and non-investment professionals) positions and/or recommendations as of a specific prior date. Due to various factors, including changing market conditions, such discussion may no longer be reflective of current position(s) and/or recommendation(s). Moreover, no client or prospective client should assume that any such discussion serves as the receipt of, or a substitute for, personalized advice from SVL or from any other investment professional. SVL is neither an attorney nor accountant, and no portion of the web site content should be interpreted as legal, accounting or tax advice.
Rankings and/or recognition by unaffiliated rating services and/or publications should not be construed by a client or prospective client as a guarantee that he/she will experience a certain level of results if SVL is engaged, or continues to be engaged, to provide investment advisory services, nor should it be construed as a current or past endorsement of SVL by any of its clients. Rankings published by magazines, and others, generally base their selections exclusively on information prepared and/or submitted by the recognized adviser.
To the extent that any client or prospective client utilizes any economic calculator or similar device contained within or linked to SVL‘s web site, the client and/or prospective client acknowledges and understands that the information resulting from the use of any such calculator/device, is not, and should not be construed, in any manner whatsoever, as the receipt of, or a substitute for, personalized individual advice from SVL, or from any other investment professional.
Each client and prospective client agrees, as a condition precedent to his/her/its access to SVL‘s web site, to release and hold harmless SVL, its officers, directors, owners, employees and agents from any and all adverse consequences resulting from any of his/her/its actions and/or omissions which are independent of his/her/its receipt of personalized individual advice from SVL.