
Weekly Newsletter September 1st to September 5th
RECAPPING LAST WEEK
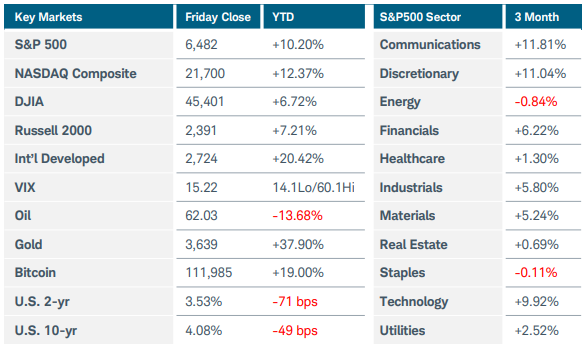
U.S. equity indices recovered from a sharp drop to start the holiday-shortened week, racing to record highs before easing slightly after the latest employment data reinforced the likelihood of upcoming interest rate cuts. The Nasdaq Composite and Russell 2000 indices each rose around 1% while the S&P500 posted a marginal gain for the week. Treasury yields and the U.S. dollar tumbled on Friday after August’s non-farm payrolls increased by just 22,000 and the unemployment rate ticked up to 4.3%. The 10-year yield settled near 4.08%, breaking below a key technical support level near 4.20%. Gold futures soared nearly 4% to new all-time highs as fed funds futures moved closer to pricing in three rate cuts this year. Additional data suggested that the U.S. labor market has been weakening more than previously thought. Last month, job openings fell below the level of those seeking employment for the first time in more than four years, while private payrolls increased less than expected and layoffs were on the rise. While the weaker jobs data increased the probability for rate cuts beyond this month’s FOMC meeting, it also heightened concerns of a broader economic slowdown developing. Earlier last week, equities sold off after a federal appeals court ruled that most of the tariffs imposed by the current U.S. administration were illegal, calling into question the hundreds of billions of dollars in revenue already generated. Rising long-term government bond yields around the globe also rattled investors as budget deficits came into focus. In other economic news, ISM manufacturing PMI remained below the 50-level expansion threshold, although last month’s new orders rose to 51.4 from 48.7. Tariffs remained a headwind with the prices paid index coming in at a still-elevated 63.7. ISM services PMI climbed to 52.0 but also revealed cost pressures. Finally, reports indicated that OPEC+ was likely to consider another production increase at their upcoming meeting over the weekend. The potential for higher supply, along with prospects of a slowing U.S. economy, sent crude oil lower by 3% to $62 per barrel. Overseas, Eurozone inflation rose slightly last month to 2.1% YoY, likely keeping the ECB in a holding pattern on rates in the near term. Core CPI was flat at 2.3% YoY while services inflation ticked down to 3.1%. In the UK, Prime Minister Starmer’s Labour party took another hit with the resignation of Deputy PM Rayner over a tax issue. Yields on the country’s 30-year gilts reached 5.68%–the highest level since 1998—as the government struggles to plug a large fiscal hole in its upcoming budget. Questions about the reliability of official economic data also surfaced after retail sales growth in the first half of 2025 was revised down to 1.1% from 1.7%, with statisticians discovering mistakes in seasonal adjustments.
THE WEEK AHEAD
With a rate cut at the next FOMC meeting being essentially priced in, the CPI and PPI releases this week will likely do little to alter that assumption, unless the readings are glaringly above expectations. For now, labor market concerns trump any modestly above-target inflation readings. However, the inflation reports will still be important for setting the tone in the Fed’s upcoming statement, especially if officials feel that tariffs may have a more lasting effect on consumer prices. Friday preliminary consumer sentiment reading for September will also be closely monitored for evolving inflation expectations. Auctions of 10- and 30-year Treasuries will arrive on the heels of last week’s jitters surrounding long-term government debt. Consumer credit figures and small business sentiment round out the domestic calendar. The Fed’s blackout period begins this weekend so there won’t be any commentary from FOMC members until the September 17 meeting. Overseas, the European Central Bank is expected to hold rates steady at Thursday’s meeting, with the next cut not being priced in until March 2026 at the earliest. This could continue to support the euro as the U.S. dollar slides from anticipated falling rates. Elsewhere, the UK releases monthly GDP numbers while China has trade balance and inflation figures on the docket.
CHART OF THE WEEK
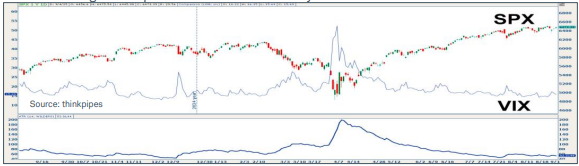
The rule of 16
The Cboe volatility index (VIX) is a weighted measure of the implied volatility of S&P 500 index (SPX) options. One perspective is that VIX reflects the expectation of movement in SPX. With VIX at 15.6 last week, how would that be interpreted for anticipated daily SPX moves? A formula known as the “Rule of 16” alongside plotting the average true range (ATR) on SPX can help facilitate this conversion and confirmation. Accounting for daily moves involves taking the square root of 252—the typical number of trading days in a year. While the actual square root equals 15.87, conventional rounding allows for a simple formula: VIX level, divided by 16, to provide the daily expected move for SPX. A VIX at 16, as was the case multiple days last week, would imply around a 1% expected daily movement. By contrast, VIX at 48 in April implied a 3% daily SPX movement. The ATR indicator measures the average range of price moves over a specific time frame, with a default setting of 14 periods. The SPX daily ATR achieved a high of 198 in April, with the index at $5,268. This validates that the actual average daily move of SPX was consistent with what VIX implied (198/5268 = 3.7%). As of last week, an ATR of 52 with SPX at $6,475 shows statistical SPX movement at 0.8% daily over the most recent 14-day duration. While neither the VIX “Rule of 16” nor the ATR indicator provides a directional bias, each metric can potentially help when assessing both expected and realized volatility.
Source: Charles Schwab Corporation
IMPORTANT LEGAL NOTICE AND DISCLOSURE INFORMATION
Investment advisory service is provided by SVL Holding Corporation dba SVL Investments Management (“SVL”), a California registered investment advisor. Advisory services are subject to advisory fees as disclosed on Form ADV.
Investing involves risks, and investment decisions should be based on your own goals, time horizon, and tolerance for risk. The forecasts or forward-looking statements are based on assumptions, may not materialize, and are subject to revision without notice. International investments carry additional risks, which include differences in financial reporting standards, currency exchange rates, political risks unique to a specific country, foreign taxes and regulations, and the potential for illiquid markets.
Past performance may not be indicative of future results. Therefore, no current or prospective client should assume that future performance of any specific investment, investment strategy (including the investments and/or investment strategies recommended or undertaken by SVL) or product made reference to directly or indirectly by SVL in its web site, or indirectly via a link to an unaffiliated third party web site, will be profitable or equal the corresponding indicated performance level(s). Different types of investments involve varying degrees of risk, and there can be no assurance that the future performance of any specific investment, investment strategy, or product (including the investments and/or investment strategies recommended or undertaken by SVL), or any non-investment related content, made reference to directly or indirectly on this site will either be suitable or profitable for a client or prospective client’s investment portfolio. Historical performance results for investment indices and/or categories generally do not reflect the deduction of transaction and/or custodial charges, the deduction of an investment management fee, or the impact of taxes, the incurrence of which would have the effect of decreasing historical performance results for investment indices.
Certain portions of SVL‘s web site (i.e. blog, Insights, newsletters, articles, commentaries, etc.) may contain a discussion of, and/or provide access to, SVL‘s (and those of other investment and non-investment professionals) positions and/or recommendations as of a specific prior date. Due to various factors, including changing market conditions, such discussion may no longer be reflective of current position(s) and/or recommendation(s). Moreover, no client or prospective client should assume that any such discussion serves as the receipt of, or a substitute for, personalized advice from SVL or from any other investment professional. SVL is neither an attorney nor accountant, and no portion of the web site content should be interpreted as legal, accounting or tax advice.
Rankings and/or recognition by unaffiliated rating services and/or publications should not be construed by a client or prospective client as a guarantee that he/she will experience a certain level of results if SVL is engaged, or continues to be engaged, to provide investment advisory services, nor should it be construed as a current or past endorsement of SVL by any of its clients. Rankings published by magazines, and others, generally base their selections exclusively on information prepared and/or submitted by the recognized adviser.
To the extent that any client or prospective client utilizes any economic calculator or similar device contained within or linked to SVL‘s web site, the client and/or prospective client acknowledges and understands that the information resulting from the use of any such calculator/device, is not, and should not be construed, in any manner whatsoever, as the receipt of, or a substitute for, personalized individual advice from SVL, or from any other investment professional.
Each client and prospective client agrees, as a condition precedent to his/her/its access to SVL‘s web site, to release and hold harmless SVL, its officers, directors, owners, employees and agents from any and all adverse consequences resulting from any of his/her/its actions and/or omissions which are independent of his/her/its receipt of personalized individual advice from SVL.