

Weekly Newsletter September 21st to September 25th
RECAPPING LAST WEEK
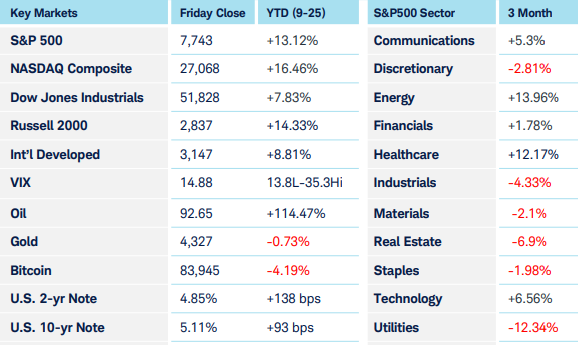
Global equity markets remained remarkably resilient last week despite a sharp rise in interest rates, with the 10-year firmly pushing through 5% with yields on maturities as short as the 3-year now at that level. Expectations are now firmly entrenched that the recent Fed hike was anything but a “one and done” as Fed Funds futures pricing now reflects a peak rate of 4.75-5% by midsummer, fully 100 basis points higher than the current band. The rise in yields was driven by persistent inflation concerns, stronger economic data in the form of a PMI report that exceeded even the high end of expectations and the whole curve adjusting to the assumption that the Fed just commenced a tightening cycle. Although small caps and the rate-sensitive Utilities, Financials, and Real Estate sectors came under pressure, the resilience of equities in the face of the bond market selloff remains one of the more notable themes of the current market environment as the Nasdaq 100 reached all-time highs and the S&P 500 is within 1% of its record close. The steep rise in interest rates was also the catalyst for a strong rally in the dollar as the widening yield spread fueled demand for U.S. assets. Crypto markets were similarly resilient with Bitcoin holding up relatively well despite the sharp move higher in real yields as another sign of a strong underlying risk appetite across the broader market. Energy markets provided an important counterweight to the rise in yields as crude oil came under pressure as expectations increased for a potential diplomatic breakthrough that could eventually lead to a full reopening of the Strait of Hormuz. Reports that the U.S. and Iranian negotiators were discussing a phased agreement at the United Nations meeting pushed crude lower at various points during the week. Diesel and gasoline prices also had a modest retreat from their elevated levels with the former falling 30 cents on the week which also led to a downtick in the elevated refining margins that had been driving investor enthusiasm for companies such as Valero, Marathon, and Phillips 66. The other major geopolitical focus was on Chinese President Xi Jinping’s state visit to the White House. While Treasury Secretary Bessent announced ahead of the visit that the two sides extended their existing trade truce by two months, there were no major new breakthroughs announced by Friday.
THE WEEK AHEAD
Investors will have a relatively light economic calendar to digest next week, with attention concentrated on two important inflation and labor-market reports. Wednesday’s PCE report, which financial market commentators seemingly can’t reference without stating is “The Fed’s preferred inflation gauge” because it accounts for goods substitution rather than focusing on a fixed basket, will provide another look whether price pressures are easing toward the stated 2% target or remaining stubbornly above it. A hotter-than-expected reading would reinforce the recent sharp rise in Treasury yields while a softer report could reduce market expectations that the terminal rate of this hiking cycle is a full 100 basis points higher than it currently is. While the market’s focus is much more heavily weighted toward inflation expectations, the most important report concerning the other half of the Fed’s dual mandate arrives Friday with the release of the U.S. unemployment report which is expected to show a continued healthy labor market with job growth of 100k while the unemployment rate holds steady at 4.1%. The Iranian situation remains a wildcard and the main geopolitical driver of energy prices.
CHART OF THE WEEK
Equal Weight, Unequal Results
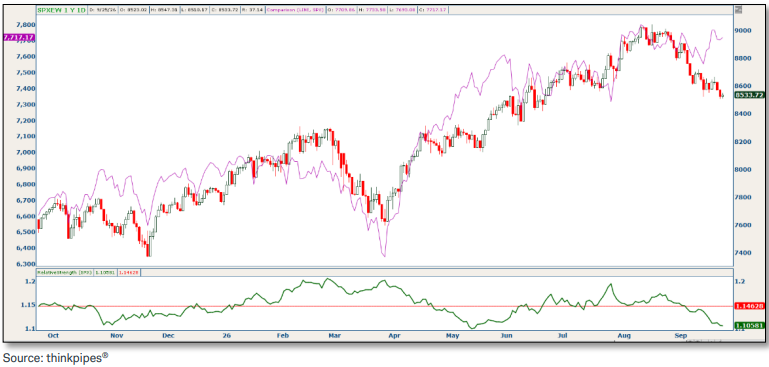
Different indexes are calculated in different ways; the two most common are market capitalization weighted and equal weighted. Then there’s the Dow Jones, which is price-weighted, allowing Goldman Sachs 10 times the influence of Coca-Cola even as a smaller company, which isn’t very helpful, but I digress. The S&P 500 (SPX) we know and love, shown by the purple line, is the more common cap-weighted index, giving larger companies more influence on the index price. The levels of concentration at the top change over time, but currently the top 5 comprise 27% of the index and the top 10 have over 37%, leaving much less for the other 490 companies. SPXEW is the equal weight index shown by the candles, and just as the name implies each company is represented equally. Both have the same components so it’s normal for them to be highly correlated, but they can diverge at times as they are now. The green line at the bottom is the relative strength of SPXEW vs SPX. SPX is not far from its all-time high while SPXEW has fallen 6%, which is also visible from the declining relative strength since early August. This is partly an AI story as the largest companies are in that space and are holding up well, but also an interest rate story as the smaller names have more debt and are therefore more sensitive to rising rates. As long as oil prices stay elevated, rates likely will too and will drag on the smaller companies, but any permanent resolution in Iran that brings oil prices back down could offer a favorable catch-up environment for smaller companies.
Source: Charles Schwab Corporation
IMPORTANT LEGAL NOTICE AND DISCLOSURE INFORMATION
Investment advisory service is provided by SVL Holding Corporation dba SVL Investments Management (“SVL”), a California registered investment advisor. Advisory services are subject to advisory fees as disclosed on Form ADV.
Investing involves risks, and investment decisions should be based on your own goals, time horizon, and tolerance for risk. The forecasts or forward-looking statements are based on assumptions, may not materialize, and are subject to revision without notice. International investments carry additional risks, which include differences in financial reporting standards, currency exchange rates, political risks unique to a specific country, foreign taxes and regulations, and the potential for illiquid markets.
Past performance may not be indicative of future results. Therefore, no current or prospective client should assume that future performance of any specific investment, investment strategy (including the investments and/or investment strategies recommended or undertaken by SVL) or product made reference to directly or indirectly by SVL in its web site, or indirectly via a link to an unaffiliated third party web site, will be profitable or equal the corresponding indicated performance level(s). Different types of investments involve varying degrees of risk, and there can be no assurance that the future performance of any specific investment, investment strategy, or product (including the investments and/or investment strategies recommended or undertaken by SVL), or any non-investment related content, made reference to directly or indirectly on this site will either be suitable or profitable for a client or prospective client’s investment portfolio. Historical performance results for investment indices and/or categories generally do not reflect the deduction of transaction and/or custodial charges, the deduction of an investment management fee, or the impact of taxes, the incurrence of which would have the effect of decreasing historical performance results for investment indices.
Certain portions of SVL‘s web site (i.e. blog, Insights, newsletters, articles, commentaries, etc.) may contain a discussion of, and/or provide access to, SVL‘s (and those of other investment and non-investment professionals) positions and/or recommendations as of a specific prior date. Due to various factors, including changing market conditions, such discussion may no longer be reflective of current position(s) and/or recommendation(s). Moreover, no client or prospective client should assume that any such discussion serves as the receipt of, or a substitute for, personalized advice from SVL or from any other investment professional. SVL is neither an attorney nor accountant, and no portion of the web site content should be interpreted as legal, accounting or tax advice.
Rankings and/or recognition by unaffiliated rating services and/or publications should not be construed by a client or prospective client as a guarantee that he/she will experience a certain level of results if SVL is engaged, or continues to be engaged, to provide investment advisory services, nor should it be construed as a current or past endorsement of SVL by any of its clients. Rankings published by magazines, and others, generally base their selections exclusively on information prepared and/or submitted by the recognized adviser.
To the extent that any client or prospective client utilizes any economic calculator or similar device contained within or linked to SVL‘s web site, the client and/or prospective client acknowledges and understands that the information resulting from the use of any such calculator/device, is not, and should not be construed, in any manner whatsoever, as the receipt of, or a substitute for, personalized individual advice from SVL, or from any other investment professional.
Each client and prospective client agrees, as a condition precedent to his/her/its access to SVL‘s web site, to release and hold harmless SVL, its officers, directors, owners, employees and agents from any and all adverse consequences resulting from any of his/her/its actions and/or omissions which are independent of his/her/its receipt of personalized individual advice from SVL.