

Weekly Newsletter September 7th to September 11th
RECAPPING LAST WEEK
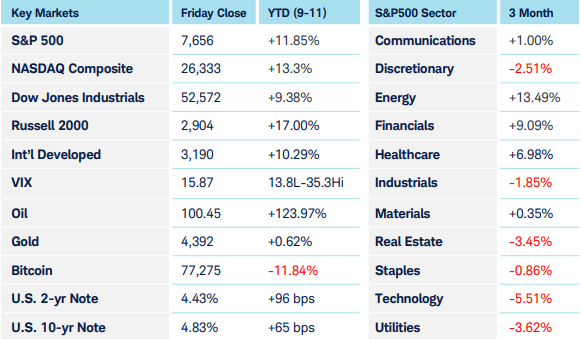
Global equity markets were under pressure last week with rising energy prices, escalating U.S.- Iran hostilities, and another leg higher in Treasury yields. U.S. equities gave back much of the gains from the prior week, with the S&P 500, Nasdaq 100, and Russell 2000 all slipping a little Tuesday through Thursday before regaining some ground on Friday. The selloff was relatively orderly, with the market continuing to focus on whether the increase in energy prices represents a temporary geopolitical shock or the beginning of a more persistent inflation problem. The biggest pressure came from the energy market as the conflict between the U.S. and Iran intensified, with the U.S. destroying Iranian oil tankers off their main export hub of Kharg Island and continued efforts by Iran to threaten traffic through the Strait of Hormuz. Iranian-backed Houthi rebels also took control of the strategic Red Sea port of Mokha, which has threatened Saudi Arabia’s ability to export oil through the Bab-al-Mandeb Strait. Brent crude surpassed $110 per barrel on Thursday and WTI $104, before pulling back in Friday’s trading. U.S. diesel prices rose to $6 per gallon as refiners continued to benefit from margins that have now surpassed the levels seen in the first month of the conflict. The rise in energy prices was accompanied by another sharp move higher in Treasury yields. The 10-year Treasury yield approached 5%, while the 30-year breached 5.40%, the latter at levels last seen in 2007. The Treasury’s announcement of a $6 billion long-term buyback failed to provide relief, with yields moving higher following the announcement. Technology and Energy saw the biggest gains among the S&P 500 sectors, while Consumer Discretionary and Healthcare were the laggards. The August CPI report came in largely in line with market expectations, showing that the headline number remained at 3.4% year-over-year while the core (which excludes food and energy) down ticked a tenth to a 2.4% annualized rate. The momentary knee-jerk response to the figures that significantly increased market expectations of a hike in the Fed Funds target rate at next week’s meeting was a selloff in Treasuries, equities, precious metals, and crypto, but within a minute, all reversed course in one of those “buy the rumor, sell the fact” type moves that is only noticed in the rear-view mirror. Friday’s reversal of the early week moves was also reflected in a compression of implied volatility in stock option pricing as the VIX retreated to its complacent levels in the mid-teens after a surge into one-month highs on Thursday.
THE WEEK AHEAD
Investors will be focused on the FOMC’s 2-day meeting, which concludes on Wednesday with the Fed Funds futures market now pricing in an 85% probability of a 25-basis point hike in the Fed Funds target rate. With $100 crude oil, longer-dated Treasuries at multi-year highs and inflation remaining above the Fed’s stated 2% target rate, markets are now concerned that the Fed’s job might not be complete with a one-and-done hike but rather may be forced into a tightening cycle. In fact, Fed Fund futures reflect only a 25% probability that rates are only 25 bps higher than the current target by year-end. Other central banks will also have rate decisions to make, with the Bank of England expected to hold rates steady on Thursday while the Bank of Japan is widely expected to hike rates by 25 bps on Friday, perhaps confirming the “asymmetric information” U.S. Treasury Secretary Bessent alluded to after undertaking the coordinated intervention to support the Yen. All things considered, U.S. equities, still buoyed by robust earnings, have shown remarkable resilience, acting like an inflatable ball pressed beneath the water’s surface in response to adverse macro influences, while shooting higher whenever the pressure is removed.
CHART OF THE WEEK
The Market Passes its Stress Test
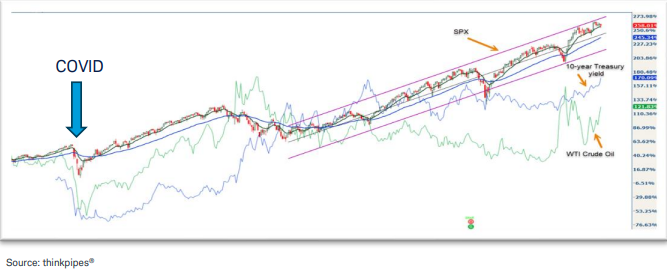
Last week we talked about bond yields but noted their relationship to equities as the yields were pressing into resistance at a 3-year high, and half of 1% away from extending that record to 19 years. We highlighted the overall strength of the U.S. stock market (SPX 10-year chart shown below) despite higher rates, yet noted if rates pushed up through resistance, especially if oil prices spiked higher, it could put the uptrend in jeopardy. This week those fears were realized in a big way. The 10-year Treasury yield (in blue) flew past the 4.8% resistance, up to nearly 5% as stated above. Then conflict with Iran escalated, again, causing concerns about oil supply through the Strait of Hormuz, again, which sent WTI crude (in green) up over $100/barrel, a price not seen since May. Add in stronger-than-expected employment data and the probability of a rate hike at next week’s Fed meeting rose from 60% to 85%. Not great news for stock market investors, making it quite intriguing that the S&P 500 lost less than 1% on the week. These factors still matter and are suppressing the magnitude of the uptrend, but corporate earnings have been strong enough to push stocks through anyway. Credit spreads and volatility have stayed relatively low, indicating these difficulties are viewed as a temporary and manageable hurdle to cross. Last week’s performance from the major indexes alone was nothing noteworthy, but spikes in interest rates and oil prices should have knocked stocks down. Their ability to hold firm despite that is noteworthy. Also noteworthy is how insignificant the COVID bear market looks now on the left.
Source: Charles Schwab Corporation
IMPORTANT LEGAL NOTICE AND DISCLOSURE INFORMATION
Investment advisory service is provided by SVL Holding Corporation dba SVL Investments Management (“SVL”), a California registered investment advisor. Advisory services are subject to advisory fees as disclosed on Form ADV.
Investing involves risks, and investment decisions should be based on your own goals, time horizon, and tolerance for risk. The forecasts or forward-looking statements are based on assumptions, may not materialize, and are subject to revision without notice. International investments carry additional risks, which include differences in financial reporting standards, currency exchange rates, political risks unique to a specific country, foreign taxes and regulations, and the potential for illiquid markets.
Past performance may not be indicative of future results. Therefore, no current or prospective client should assume that future performance of any specific investment, investment strategy (including the investments and/or investment strategies recommended or undertaken by SVL) or product made reference to directly or indirectly by SVL in its web site, or indirectly via a link to an unaffiliated third party web site, will be profitable or equal the corresponding indicated performance level(s). Different types of investments involve varying degrees of risk, and there can be no assurance that the future performance of any specific investment, investment strategy, or product (including the investments and/or investment strategies recommended or undertaken by SVL), or any non-investment related content, made reference to directly or indirectly on this site will either be suitable or profitable for a client or prospective client’s investment portfolio. Historical performance results for investment indices and/or categories generally do not reflect the deduction of transaction and/or custodial charges, the deduction of an investment management fee, or the impact of taxes, the incurrence of which would have the effect of decreasing historical performance results for investment indices.
Certain portions of SVL‘s web site (i.e. blog, Insights, newsletters, articles, commentaries, etc.) may contain a discussion of, and/or provide access to, SVL‘s (and those of other investment and non-investment professionals) positions and/or recommendations as of a specific prior date. Due to various factors, including changing market conditions, such discussion may no longer be reflective of current position(s) and/or recommendation(s). Moreover, no client or prospective client should assume that any such discussion serves as the receipt of, or a substitute for, personalized advice from SVL or from any other investment professional. SVL is neither an attorney nor accountant, and no portion of the web site content should be interpreted as legal, accounting or tax advice.
Rankings and/or recognition by unaffiliated rating services and/or publications should not be construed by a client or prospective client as a guarantee that he/she will experience a certain level of results if SVL is engaged, or continues to be engaged, to provide investment advisory services, nor should it be construed as a current or past endorsement of SVL by any of its clients. Rankings published by magazines, and others, generally base their selections exclusively on information prepared and/or submitted by the recognized adviser.
To the extent that any client or prospective client utilizes any economic calculator or similar device contained within or linked to SVL‘s web site, the client and/or prospective client acknowledges and understands that the information resulting from the use of any such calculator/device, is not, and should not be construed, in any manner whatsoever, as the receipt of, or a substitute for, personalized individual advice from SVL, or from any other investment professional.
Each client and prospective client agrees, as a condition precedent to his/her/its access to SVL‘s web site, to release and hold harmless SVL, its officers, directors, owners, employees and agents from any and all adverse consequences resulting from any of his/her/its actions and/or omissions which are independent of his/her/its receipt of personalized individual advice from SVL.